Hit it!
It takes two to make a thing go right
It takes two to make it outta sight
Rob BASE & D.J. E-Z Rock told us in 1988, but it’s been true about the market forever – it takes two to make it go right.
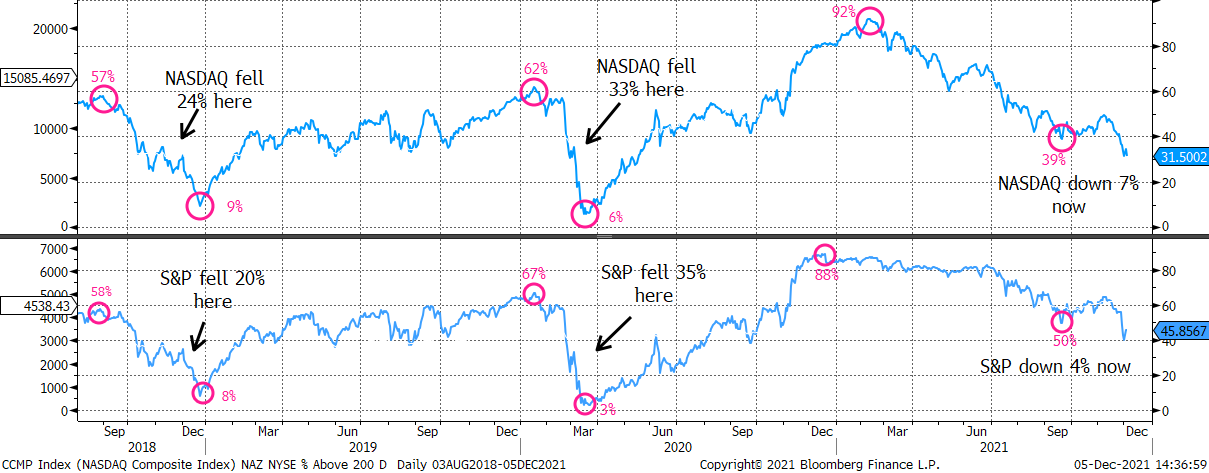
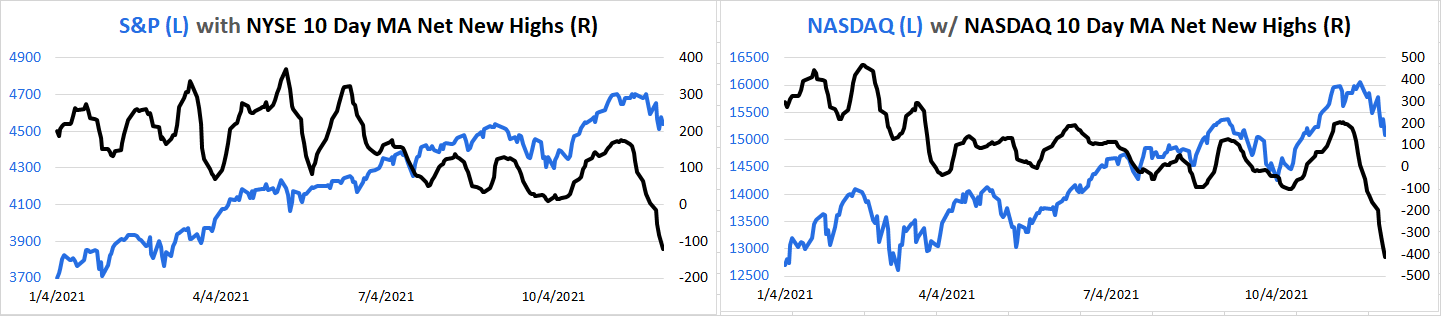
2021 has been a very strange year because – and no matter how the industry has been bamboozled by the indexes – the S&P’s internal peak occurred on December 17, 2020, and NASDAQ’s internal peak on Feb 10, 2021, since that’s when the percent of stocks above their 200-day moving averages peaked. But even if you’d laugh, or worse, at such a claim, how ‘bout the one that says the NYSE’s internal peak was on May 10, 2021, and NASDAQ’s on Feb 8, 2021, because that’s when their New Highs peaked?
It takes two – % Above 200-Day Mov Avgs and New Highs – to make a thing go right
It takes two – % Above 200-Day Mov Avgs and New Highs – to make it outta sight
Isn’t it a bit odd that NASDAQ and the S&P can be down so little when their internals are so bad?
Source: 22V Research
It takes two to make a thing go right
It takes two to make it outta sight
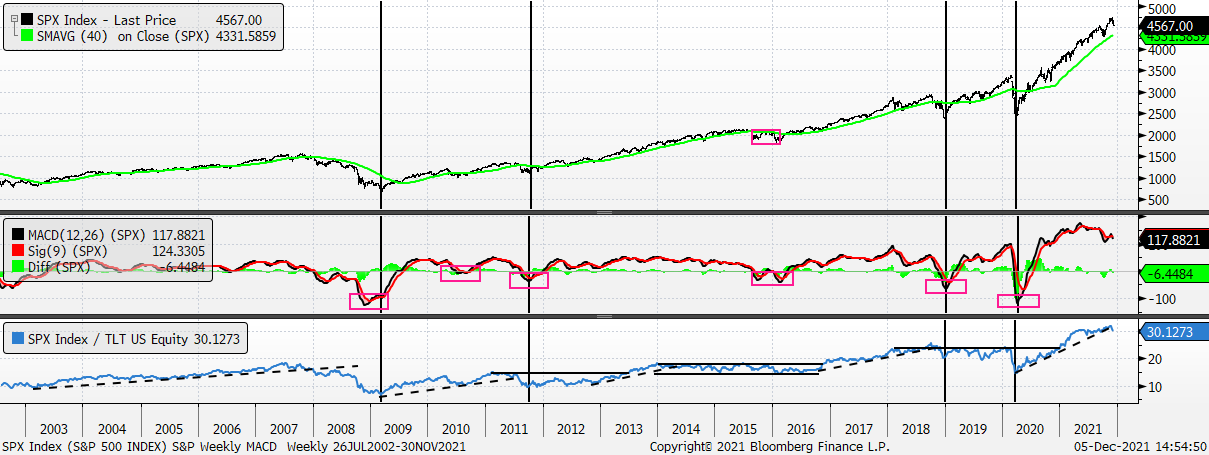
And while those two indicators have been weakening since the early part of 2021, at least, we now have two other indicators that show important and concerning change. For example, the weekly MACD for the S&P – in the top panel – peaked in May (same time as the number of New Highs peaked for the NYSE) and has been slowly weakening since; yet it remains in OVERBOUGHT territory! Too, the S&P relative to the TLT (bond price proxy) – in the bottom panel – peaked on November 12 and is now below its uptrend line that had been in force since the COVID low.
There are a few things to consider here looking at the MACD in the top panel: (1) Would you buy that chart by itself? Knowing that it has, not only, crested and is rolling from the greatest overbought in history yet it remains in overbought territory at the same time? (2) What do you think of the MACD’s current level in relation to the prior six oversold readings going back to 2008? (3) Will the MACD have to get into even modest negative territory to evince a good oversold reading? Talk amongst yourselves.
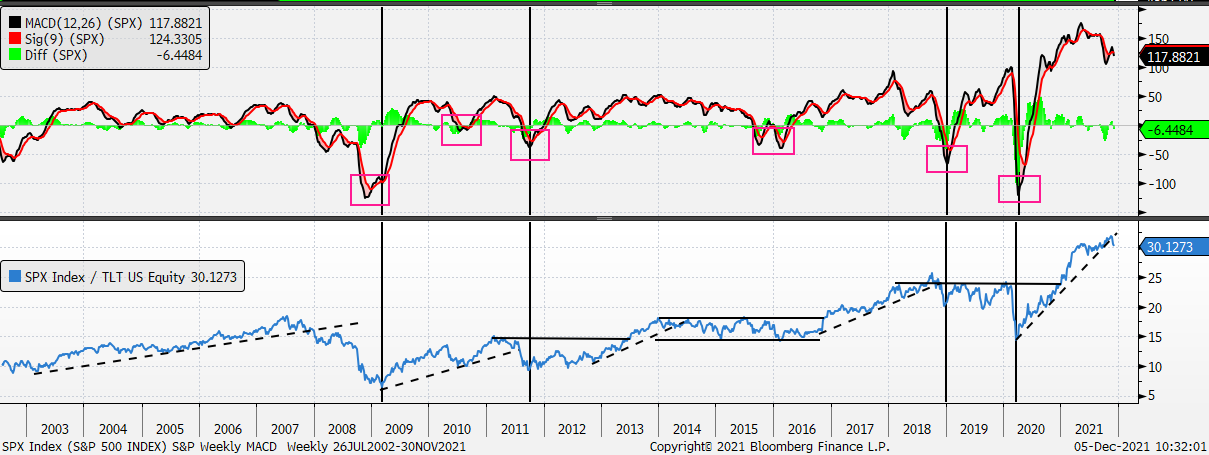
And what of the change in the relative ratio between the S&P and the TLT? Hasn’t every other trendline break where the S&P is no longer outperforming the TLT also been associated with weakening S&P momentum? And hasn’t that weakening momentum always resulted in the MACD getting into negative territory? You can dismiss, if you want, the prior technical inputs but when the TLT is outperforming the S&P it’s always a bad sign for stocks.
It takes two – firm / strong weekly momentum and S&P outperforming TLT – to make a thing go right
It takes two – firm / strong weekly momentum and S&P outperforming TLT – to make it outta sight
In addition to the crummy internal picture for the NYSE, S&P and NASDAQ and the S&P’s own topping/ softening weekly MACD and the now notable trend change between the S&P and TLT, we get the distinct sense that anecdotal sentiment is wholly complacent as investors are betting that “seasonals” will sing the Mighty Mouse theme song and come to save the day.
We don’t see it that way. Rather, we believe any rally should be sold and that the market’s correction – at least this stage – will continue until the S&P and NASDAQ retest their early October lows which would represent a 10% setback (convenient, right) and a 12 ½% decline for NASDAQ. Further, because the environment between the S&P and the TLT has changed we believe equities will remain – politely – challenged. In short, and we said this in our notes from last week, we believe the S&P and NASDAQ have made their cycle highs. Oh yeah, one more thing, we also continue to believe NASDAQ will underperform the S&P.
Here’s the S&P with its 40-week moving average, weekly MACD, and relative to the TLT.
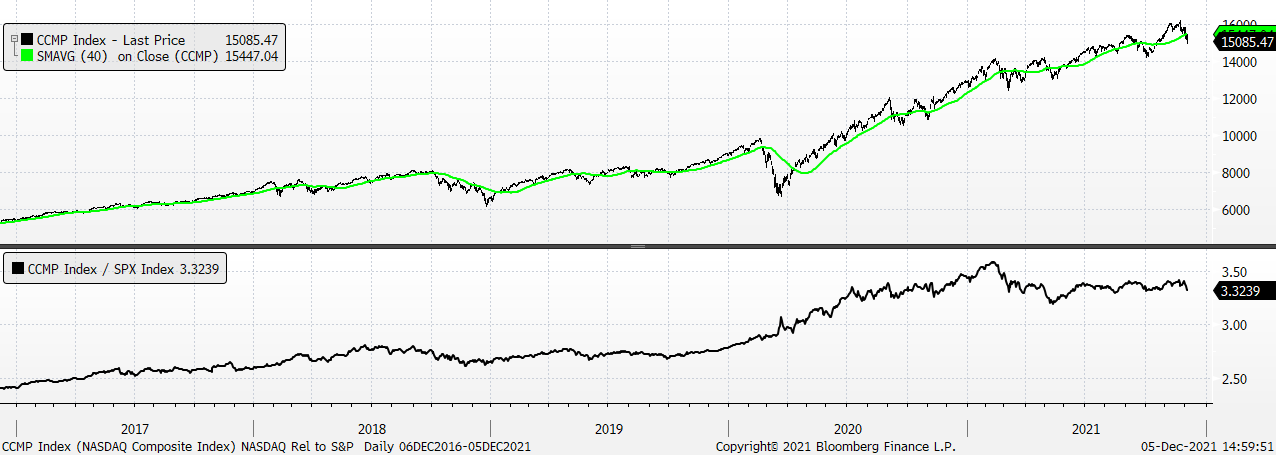
Here’s the NASDAQ with its 40-week moving average and relative to the S&P. The relative chart is, with a hat tip to Lionel Richie, “dancing on the ceiling” / topping and we’re expecting it to turn down in favor of the S&P.