What Would You Do?
 Let’s say there’s a stock in your portfolio that has the following poor technical inputs. What would you do with it?
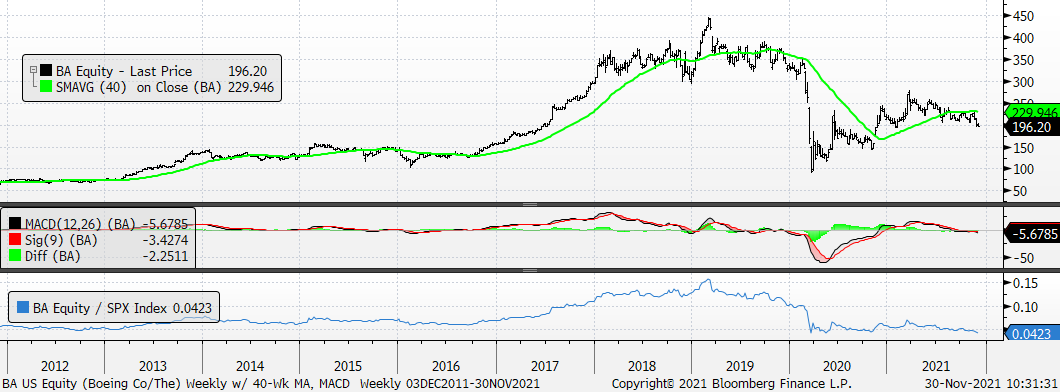
All the above inputs are true for Boeing (BA). We believe it’s a sale here with risk to 150 next. However, it would not surprise us to see BA retest 100. Weekly chart for Boeing follows here.