When Will EM Actually Emerge?
For a long time, the EM appellation has struck us as a curious misnomer. We mean, it seems pretty ridiculous that China – with a GDP of nearly $15T and 2nd only to the US – and India – with a GDP of $2.75T that is good for 5th biggest on the world’s stage – and South Korea – with a GDP of $1.5T and bigger than the GDP of Australia and Spain – can still be termed Emerging Markets. Isn’t it time that they graduated?
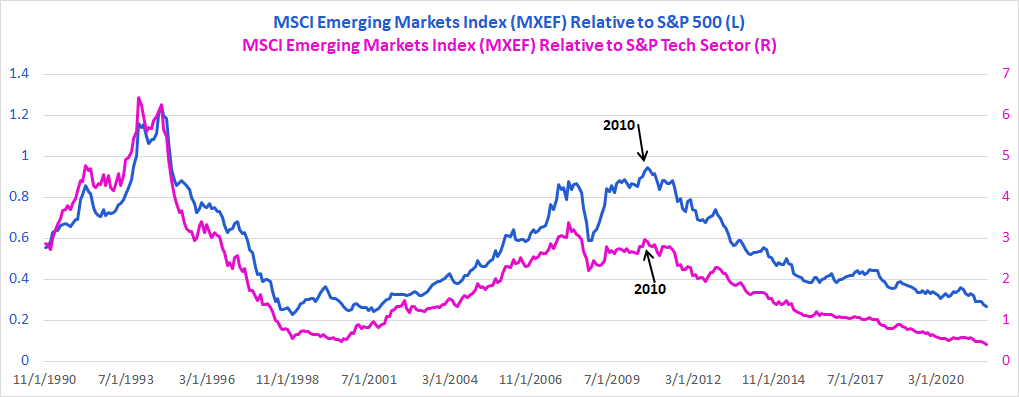
Less ridiculous is that EM has underperformed the S&P in 9 of the last 11 years with 2017 as the last year in which the MSCI Emerging Markets Index (MXEF) beat the S&P. The only other time in the last 11 years when EM beat the S&P was in 2012. Principally, the reason that EM can’t beat the S&P is that the S&P is – virtually – a tech index. For example, the pink line in the chart below shows the MXEF relative to the S&P’s Tech Sector and EM has underperformed Tech in 10 of the last 11 years. There is almost no way EM can outperform the S&P unless Tech weakens. As an aside, Standard & Poor’s has Tech with a 29% market cap weighting within the S&P 500 and this is a canard. The six biggest tech stocks in the S&P – Alphabet, Amazon, Apple, Meta Platforms, Microsoft, and NVIDIA – account for 24% of the market cap in the index so we’re dubious that the entirety of Tech is only 29% of the S&P.
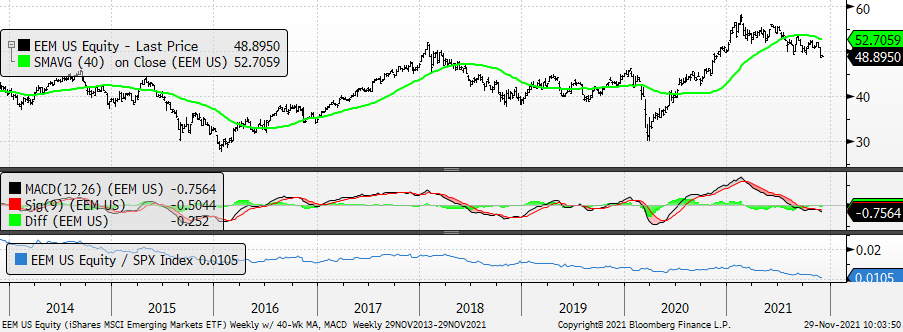
Our Technical Scoring System (see below for a broader list) has the iShares MSCI Emerging Markets ETF with a Technical Score = 0. In addition, the EEM is below its downward-sloping 40-week moving average, weekly momentum is accelerating lower within negative territory, and last week the ETF gapped down to its lowest level since November 2020.
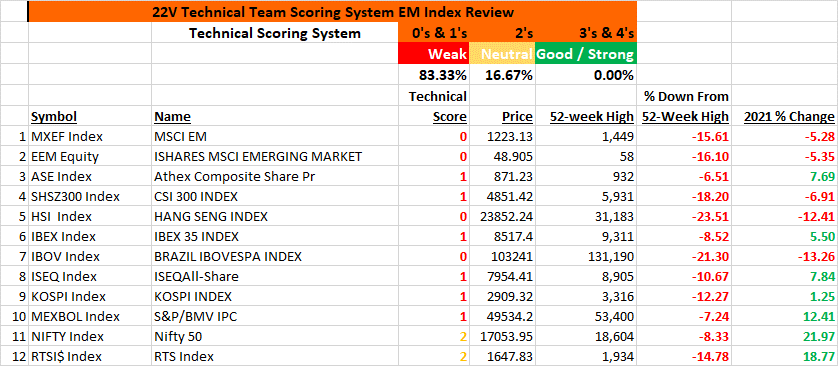
What follows is not exclusively a list of EM Indexes because we’re including Spain, but if China and India and South Korea can be termed Emerging Markets, we don’t think it’s out of line to include the IBEX here. Aside from the poor Technical Scores for the MXEF and EEM please notice that only two markets – the Nifty 50 of India and the RTS Index of Russia – have Neutral Scores while the remaining eight indexes have Weak Scores.
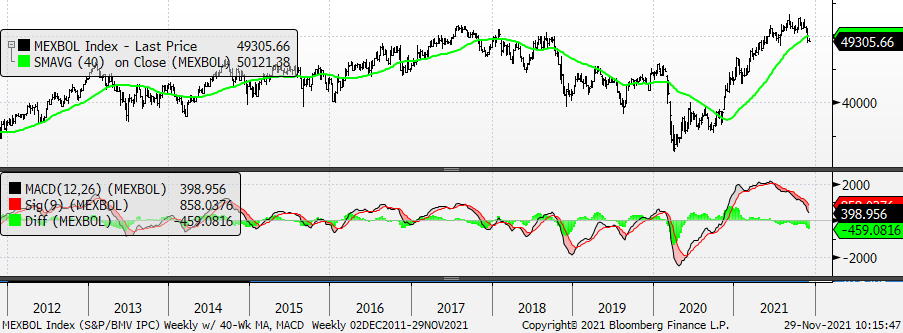
Most concerning right here is the action in Mexico as the S&P / BMV IPC Index has a Technical Score = 1, shows fast decelerating momentum, moved last week to its lowest level in four months, had a “fake breakout” of its own in early September 2021, and now has important resistance at the 50,000 level. 50,000 was a big obstacle in 2017 – 2018 and the sharp recent reversal lower at this area reinforces the resistance.
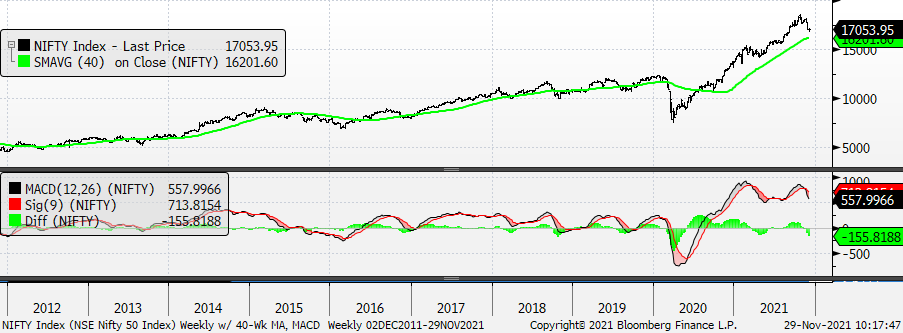
Lastly, while the Nifty 50 Index of India remains in a well-defined uptrend it would not surprise us if the index pulled back further. From its March ’20 low – its Oct ’21 high the Nifty was up almost 150% with 15 months of gains vs. 5 months of losses (including Nov ’21). Additionally, our weekly momentum work did not corroborate the new high in the Nifty (middle panel) and has now turned lower, too. Even Usain Bolt rested after his races.