The Not So Magnificent Eleven
 Depending on your frame of reference, you might recall the early 60s movie, “The Magnificent Seven” or the early 80s song of the same name by The Clash.
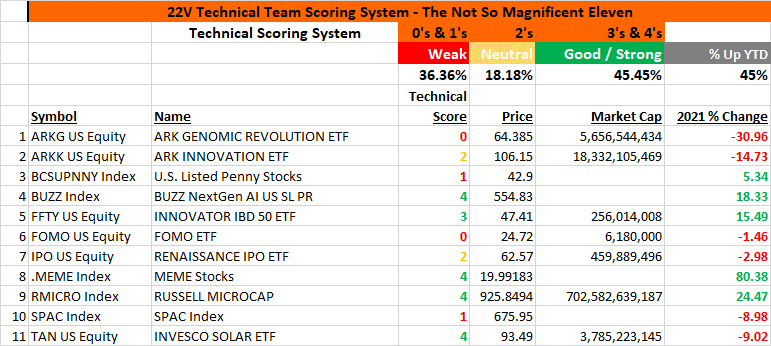
And we thought of both, the movie, and the song, while reviewing the following list of speculative ETFs and indexes that we’re calling “The Not So Magnificent Eleven.” In short, this grouping is a good representation of the market’s appetite for risk / speculation and after you see the Scores and charts below, you’ll agree that they do not paint a monolithic picture and, if we’re right about them being representative of speculative behavior, much of the fever that attended these ETFs and indexes earlier in the year has been erased.
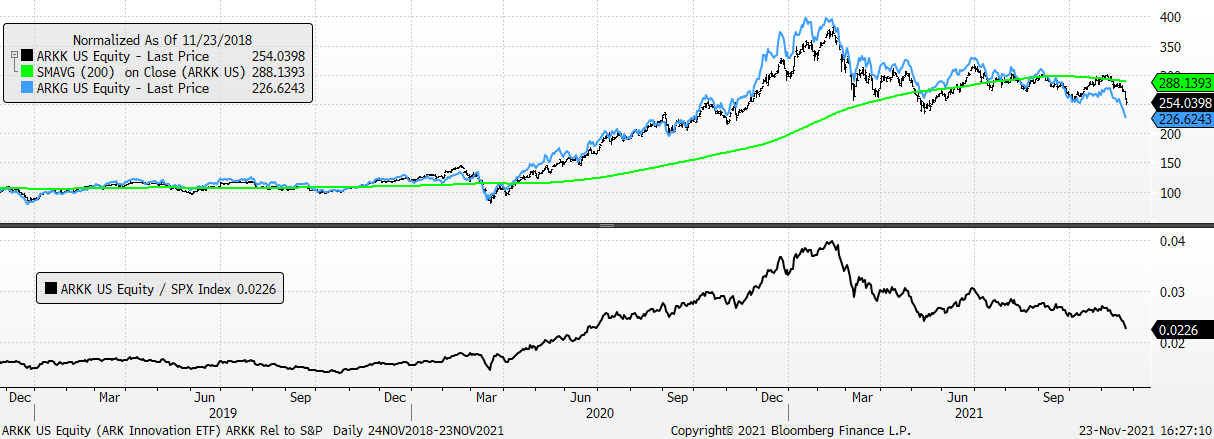
Over the last few days, in “You’re Going to Need a Bigger Boat” and “Rock the Boat” we reviewed – in technical detail – the ARKK and ARKK situations and believe both will work lower. The chart here shows ARKK (with its now rolling 200-day moving average) and ARKG in the top panel with ARKK Rel. to the S&P 500 in the bottom panel. Absolute and relative trends are clearly nasty.
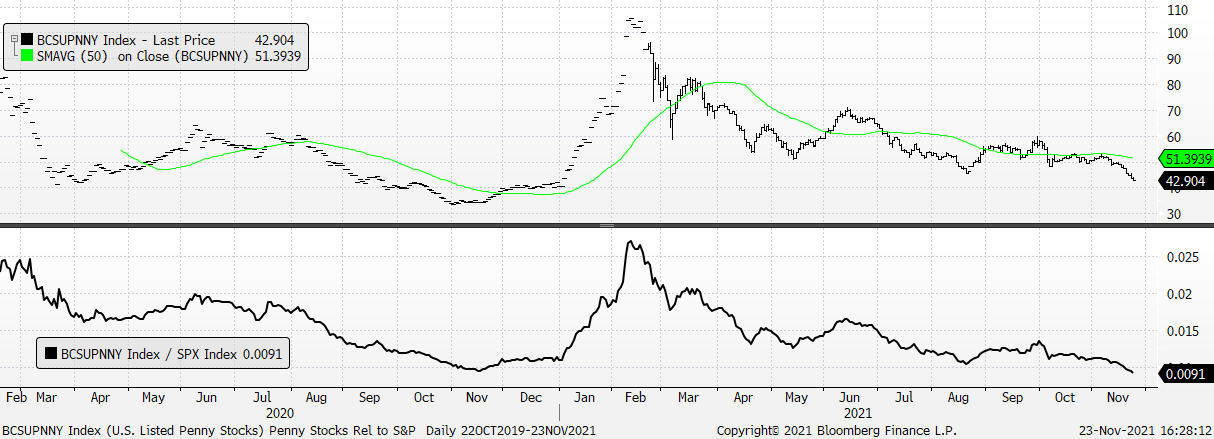
Absolute and relative price action for the US Listed Penny Stocks Index is bearish .
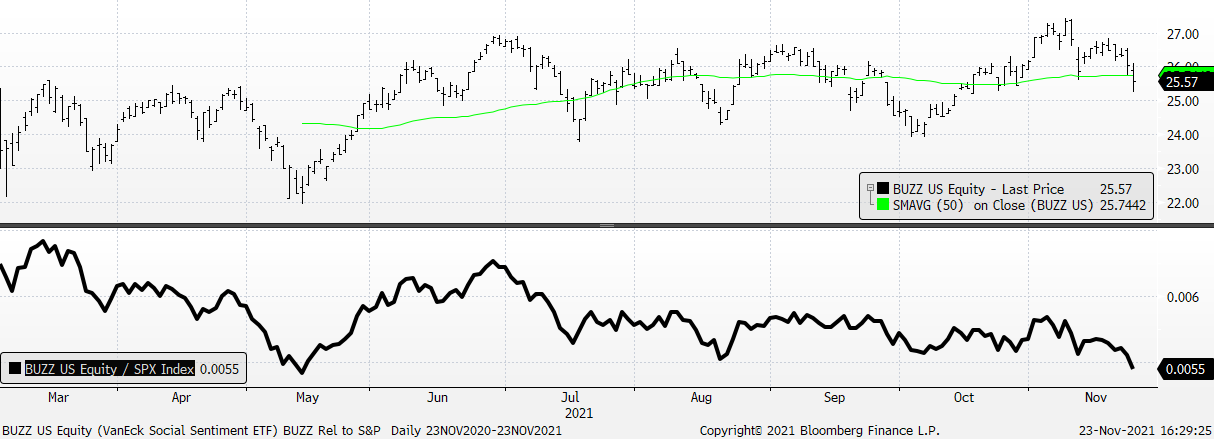
The VanEck Social Sentiment ETF is hanging in well on an absolute basis (top) but is weak on a relative basis vs. the S&P 500.
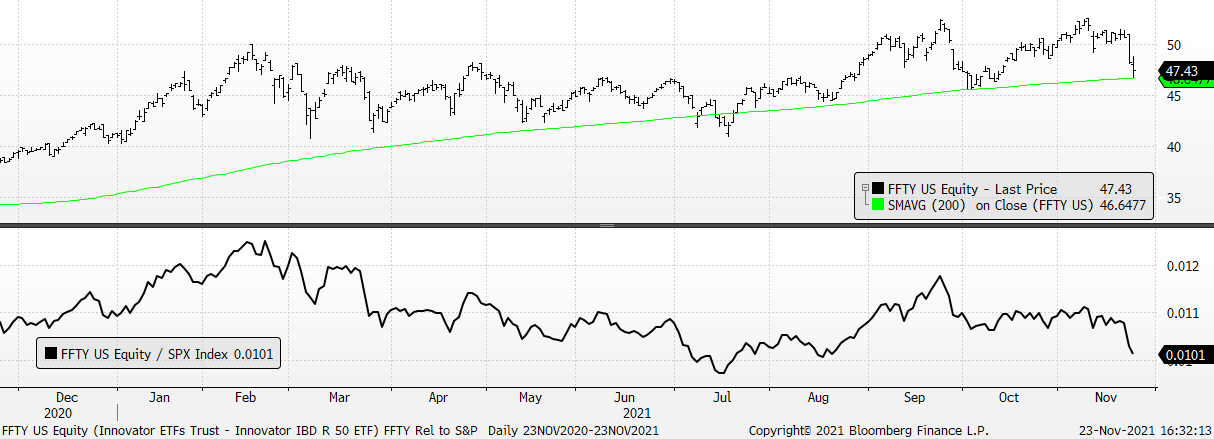
Holding support at its upward-sloping 200-day moving average for now, but we believe support for FFTY breaks.
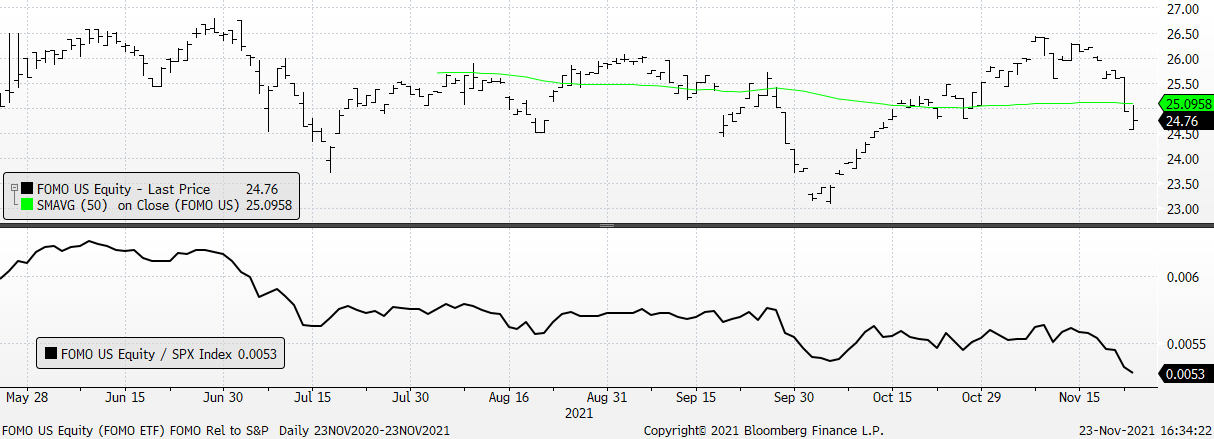
FOMO is also negative across the board.
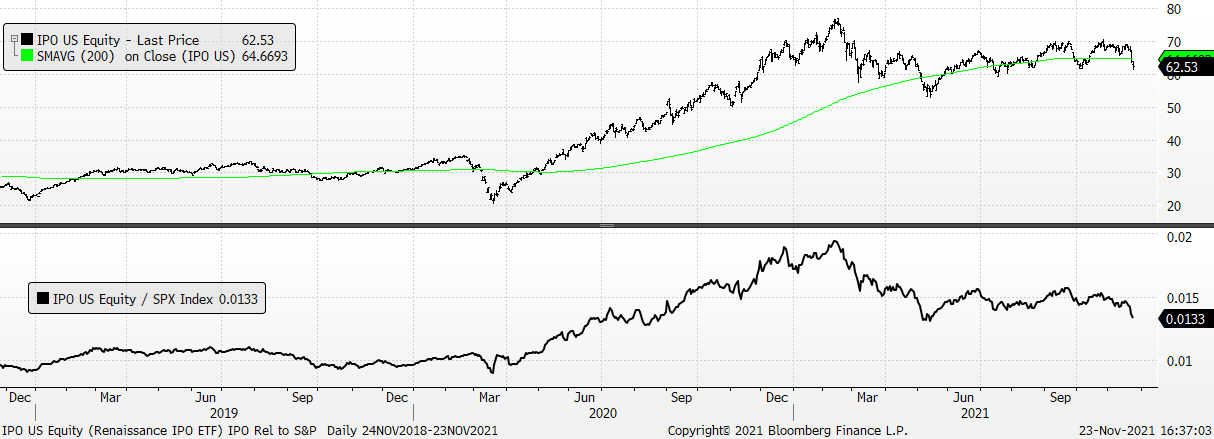
Price action for the Renaissance IPO ETF looks distributive. It got the Dikembe Mutombo treatment at 70 from early September – November (we’ll sell any bounce) and its relative action vs. the S&P 500 is failing. Risk to the low 50s.
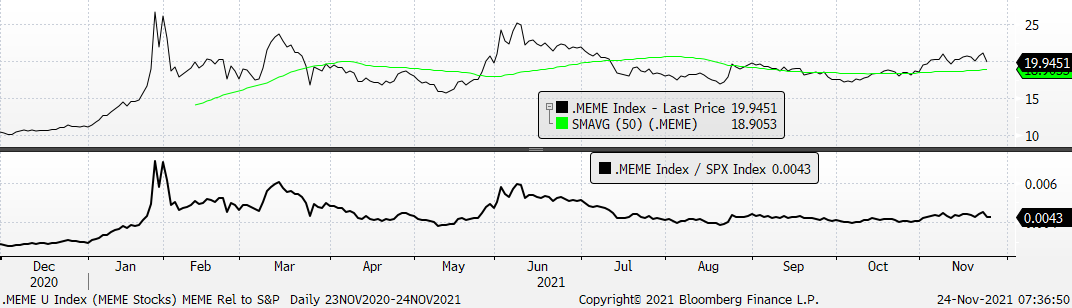
With help from Bloomberg, the MEME Index is in better shape than most of the other Not So Magnificent Eleven. In fact, it looks very much like GameStop (GME). Let us know if you want to see the other components of the MEME Index.
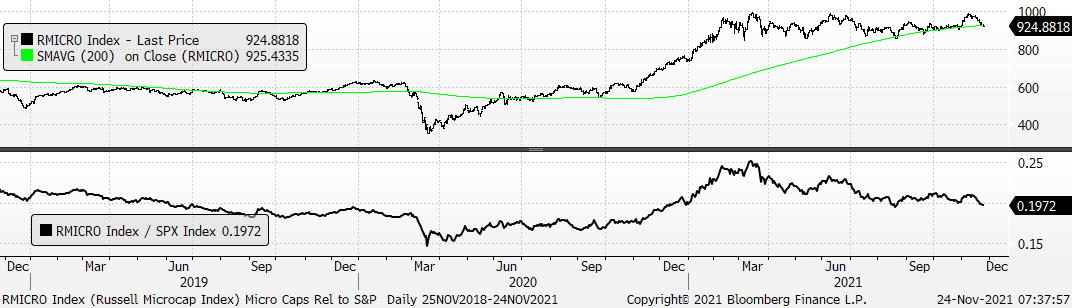
The Russell Microcap Index gets the benefit of the doubt for now, but 1000 looks like important resistance and relative price action vs. the S&P 500 (bottom panel) is close to breaking.
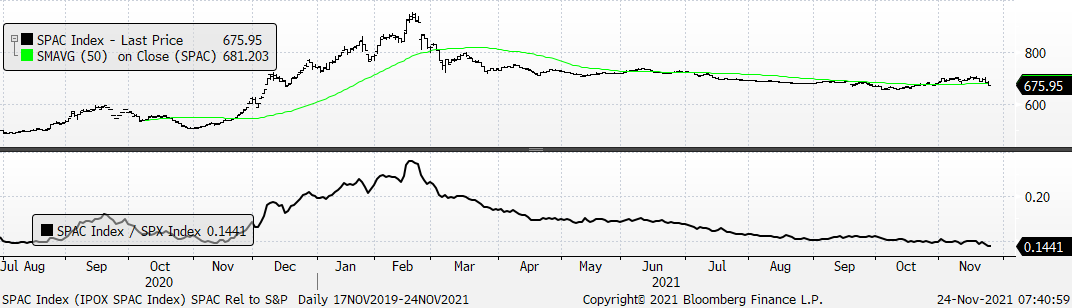
In a phrase, SPAC Index is wack.
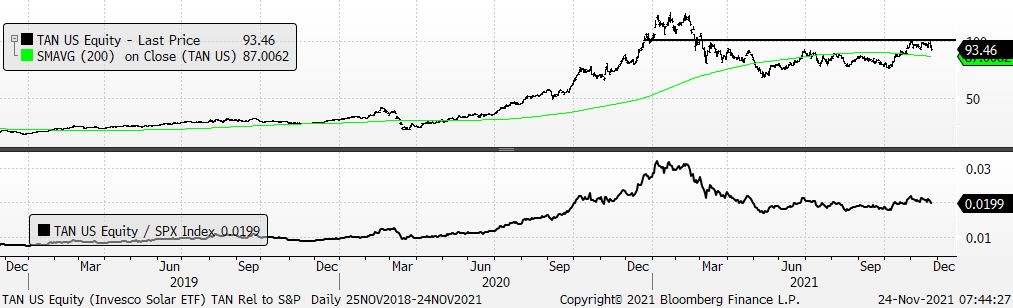
Lastly, the Invesco Solar ETF also recently got the Dikembe Mutombo treatment at the 100 level which now looks like formidable resistance. We’re better sellers here and relative action vs. the S&P (lower panel) is similarly softening.