Rock the Boat
If you’re of a certain age you might remember that “Rock the Boat”, by The Hues Corporation, was first released in the early 70s but didn’t become a hit until it made it to the disco playlists. And even if you don’t remember that era, you’ll likely agree the 70s were funky and that the song’s title makes a good intro to another note (“ARKK’s Going to Need a Bigger Boat”) about the ARK Innovation ETF (ARKK). Updated lyrics might even look like this…
Up to now we sailed through every storm
And I’ve always had your stock tips to keep me warm
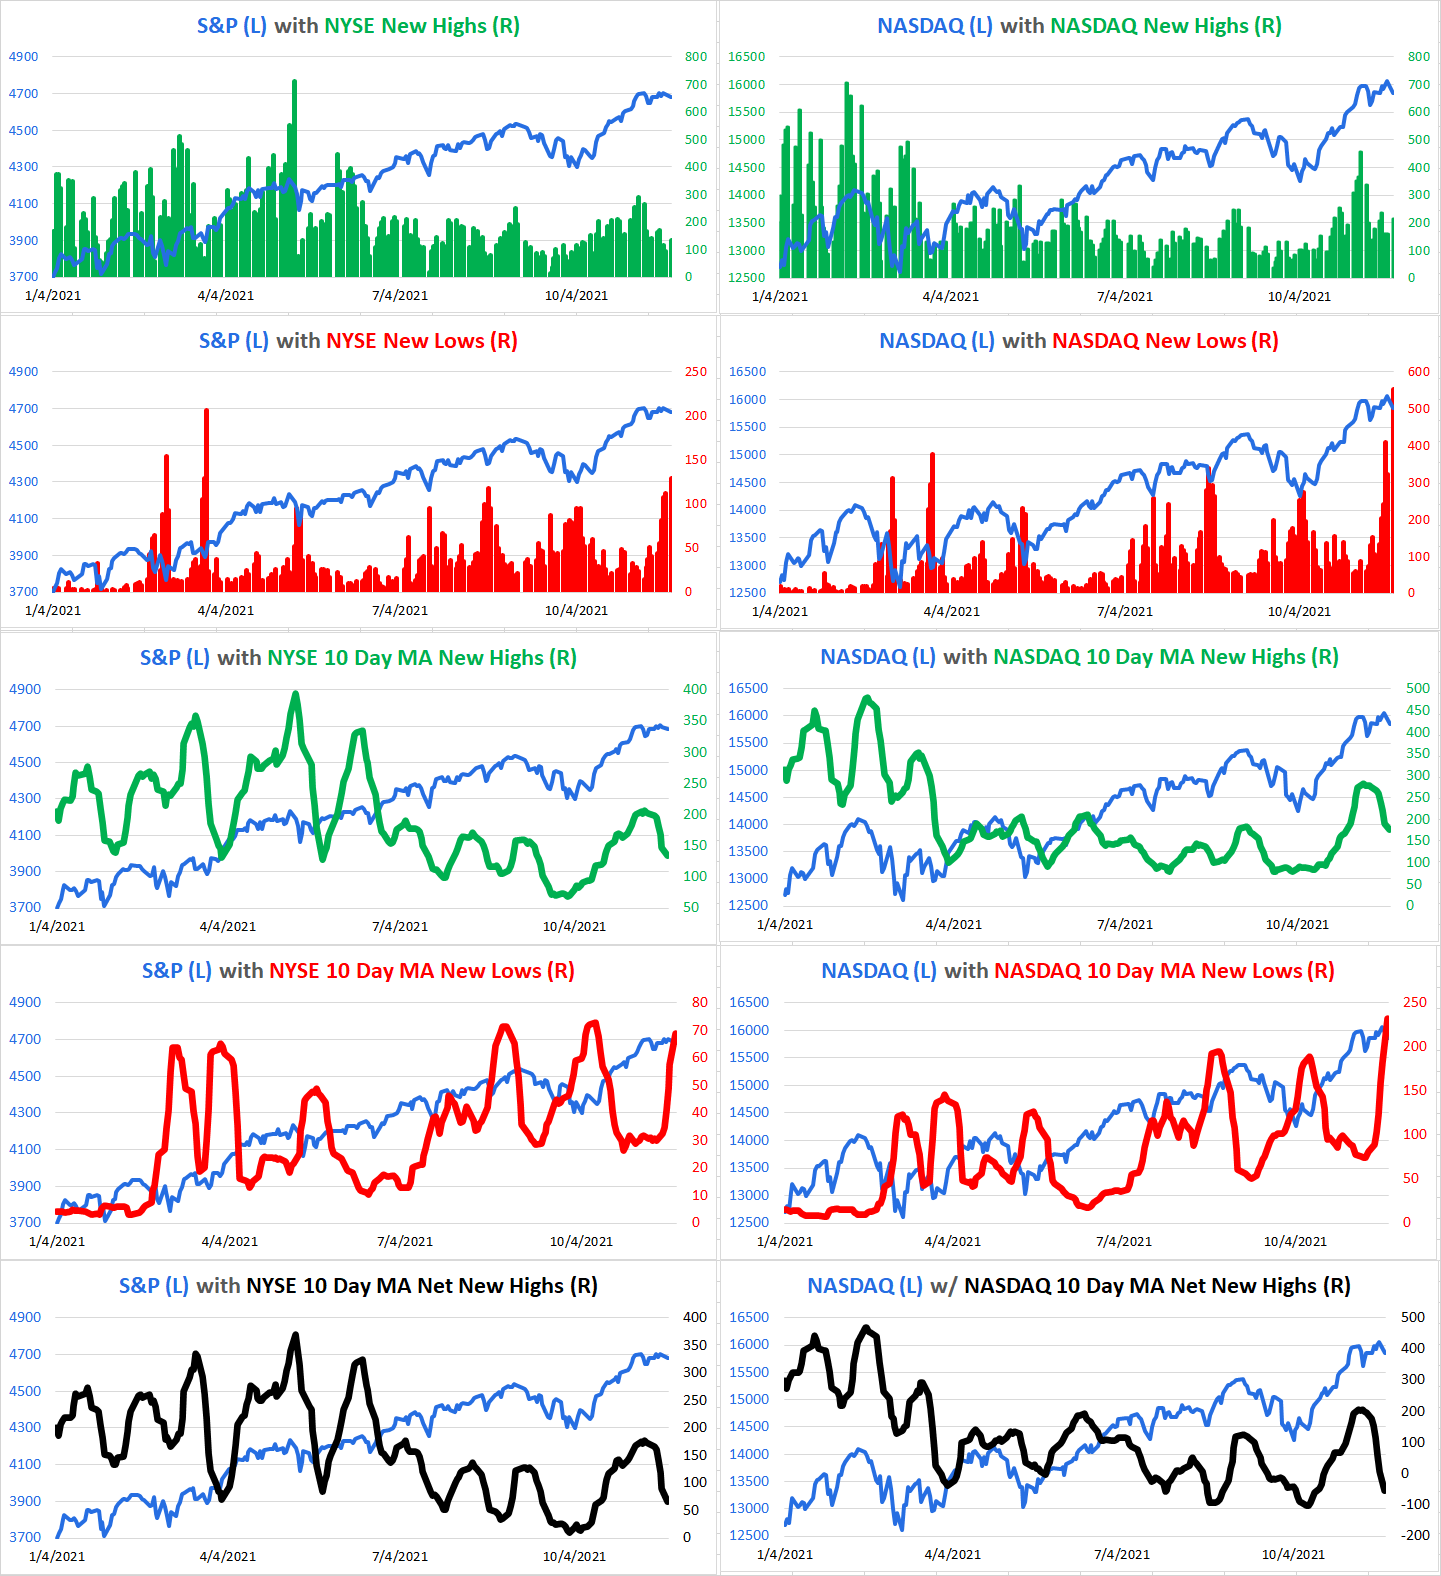
However, “Rock the Boat” is not only an ARKK analogy – which we’ll get to in a minute – it’s true, as well, for the market. In a note from last week titled, “Manute and Muggsy” – and in 22V’s Friday Webinar – we showed the deteriorating condition for the market’s internals as represented by the number of New Highs and New Lows on both the NYSE and NASDAQ. The condition has worsened.
New Lows on NASDAQ jumped yesterday to 554, higher than last Thursday’s figure of 409 and the highest since March 23, 2020, when NASDAQ recorded 781 New Lows. For those keeping score at home March 23, 2020, was THE COVID LOW (!) with NASDAQ off 33% from its February 19, 2020, high. So how weird is it that NASDAQ can record 554 New Lows on the same day that it made a new all-time high?! Really weird. We realize that the title of the Reinhart and Rogoff book was offered tongue-in-cheek, “This Time is Different: Eight Centuries of Financial Folly” (2009) but the current expansive New Low situation for NASDAQ stocks with the NASDAQ index at an all-time high is conflicting, contradictory, and mismatched. New Lows on the NYSE also rose yesterday to 129 (New Highs rose at the same time which is another technical concern), but the data for NASDAQ is a major issue. It’s a truism – even though it’s our truism – that NOBODY makes money on the long side (consistently) when New Lows outnumber New Highs.
Source: 22V Research
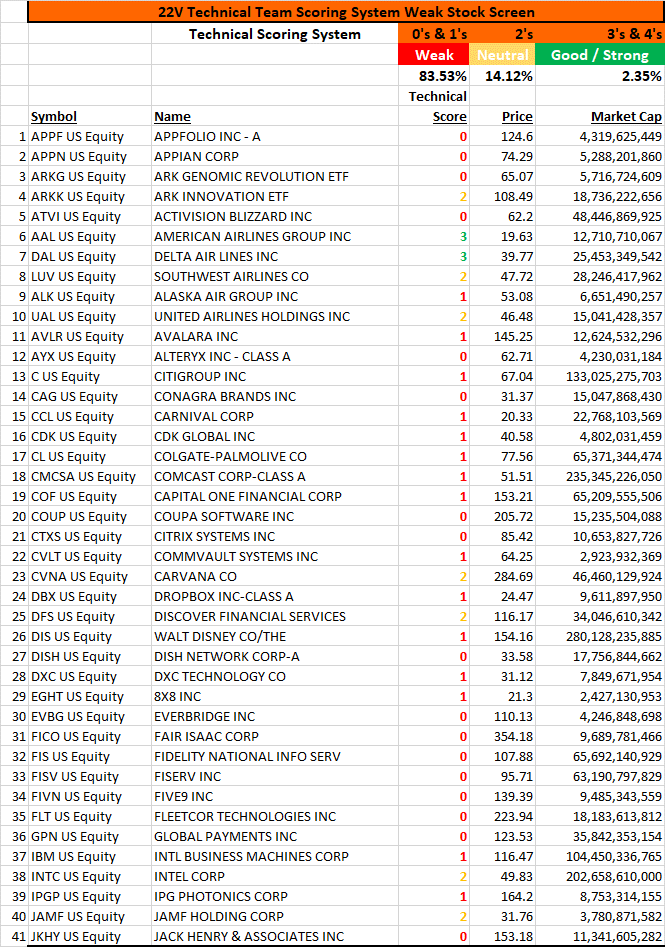
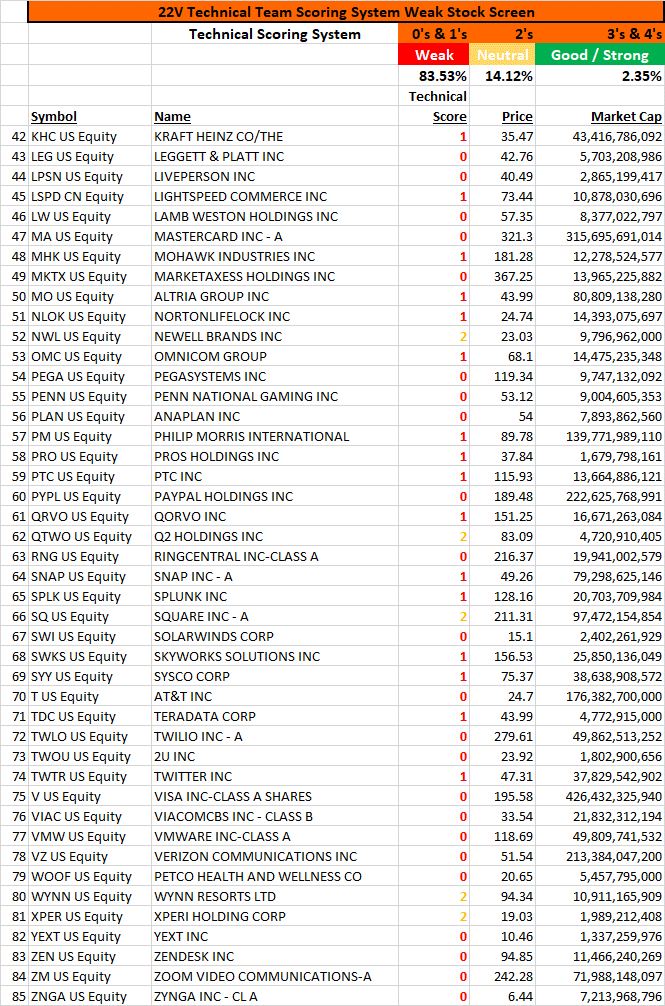
Here’s our list of stocks that Score poorly in our Technical Scoring System. We’ve been using this list when speaking to investors looking for shorts.
Source: 22V Research
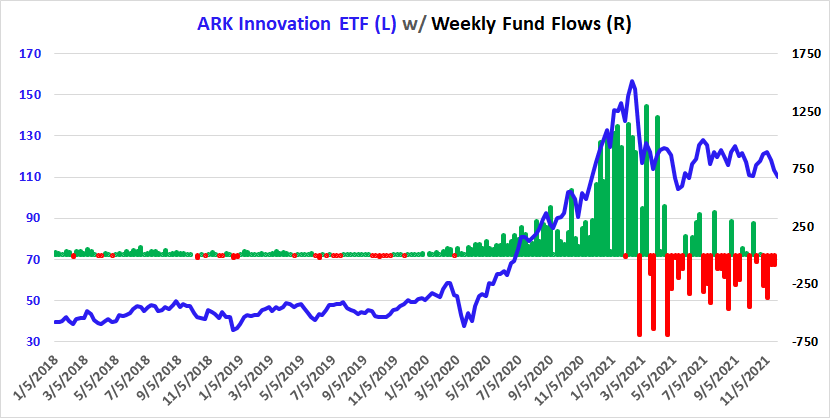
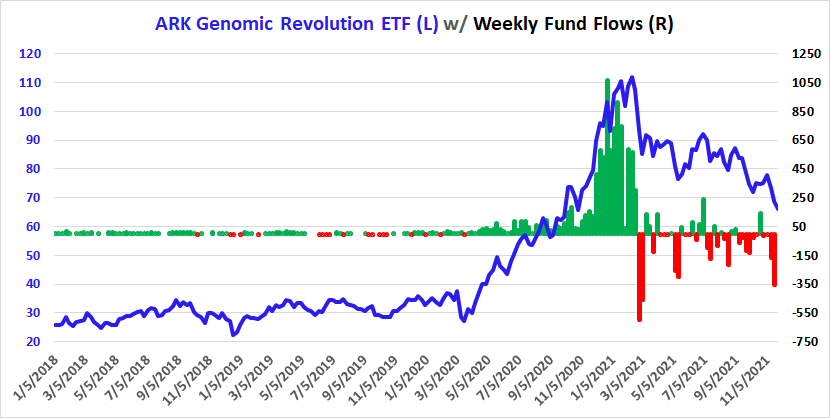
ARK Innovation and ARK Genomic Revolution ETFs (ARKK and ARKG, L) had their greatest inflows from the autumn of 2020 – early 2021 but since early March fund flows, and our technical take on both ETFs, have been negative. We wondered then and still wonder, “If ARKK is so special, why is its performance so punky?”
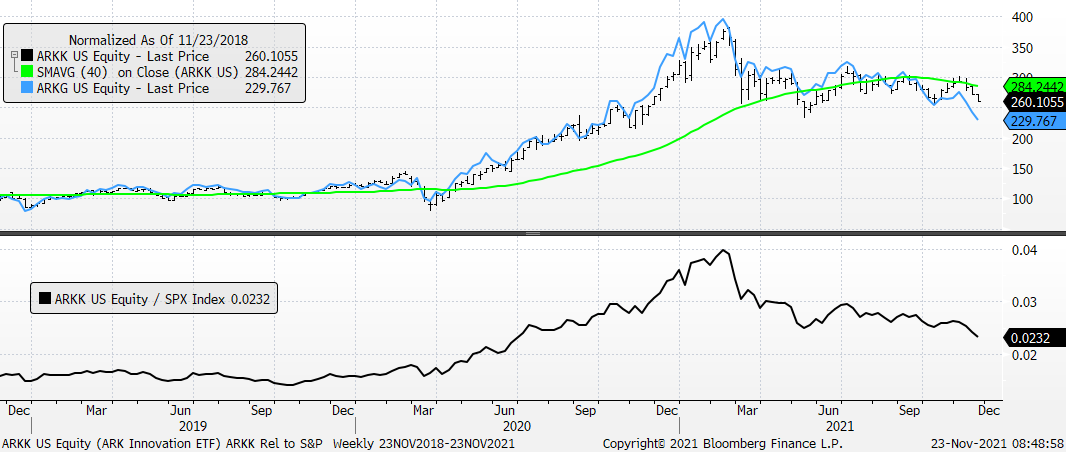
Technical action / price trends for the ARK Innovation ETF are weakening on an absolute basis and are bearish relative to the S&P 500 while the technical action / prices trends for the ARK Genomic Revolution ETF are weaker on both an absolute basis and when compared to the S&P 500. We’re expecting both will work lower.
Beneath the Fund Flow charts we show a version with ARKK and ARKG in the top panel (the 40-week moving average is for ARKK) and then in the lower panel its ARKK Relative to the S&P 500. It’s no stretch to say that technical skills are not needed to identify these items as having bearish trends.
Lastly, please check our Technical Scoring for the stocks that comprise the ARKK ETF. As of yesterday’s close, the total scoring was weak with only 27% of the stocks having good / strong Technical Scores and only 39% of the current holdings in positive territory in 2021. We realize that a portfolio doesn’t have to have a plurality of stocks with positive year-to-date performance for it to make money, but it sure does make it easier.

ARKK and ARKG with Weekly Fund Flows
Source: 22V Research
ARKK w/ 40-Week Moving Average and ARKG (top panel) with ARKK Rel to S&P (bottom panel)
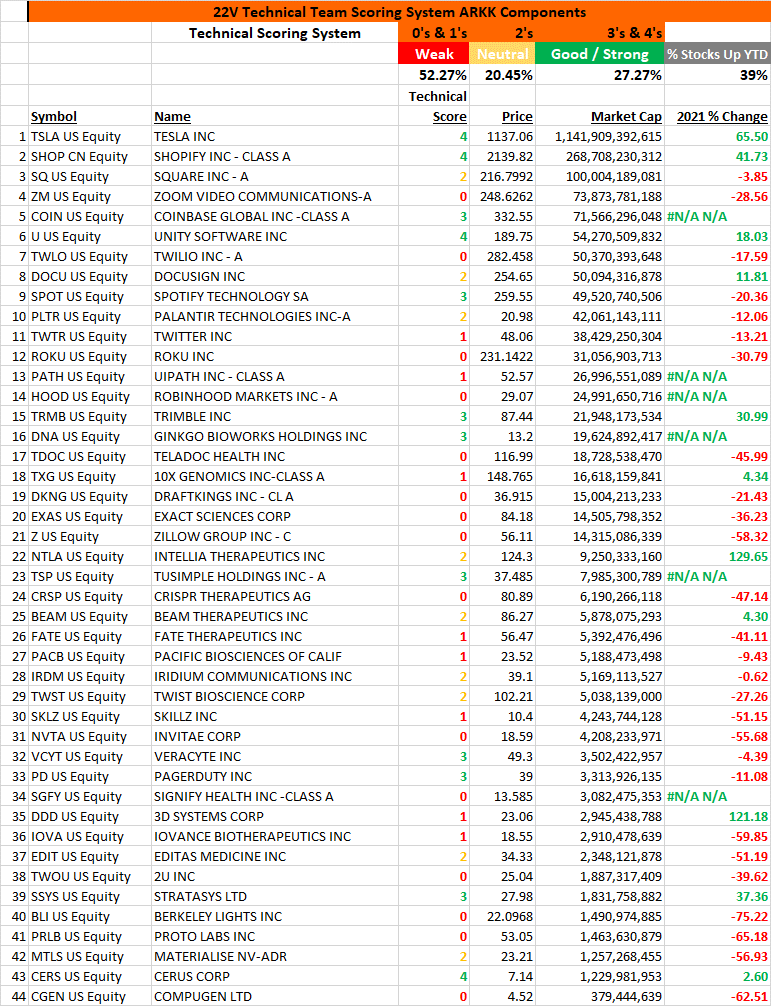
Source: 22V Research
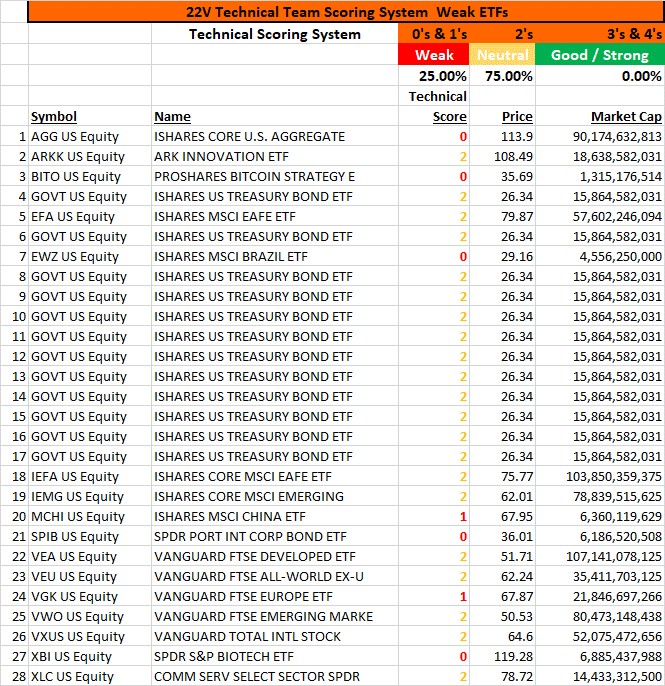
Here’s a list of weak ETFs.
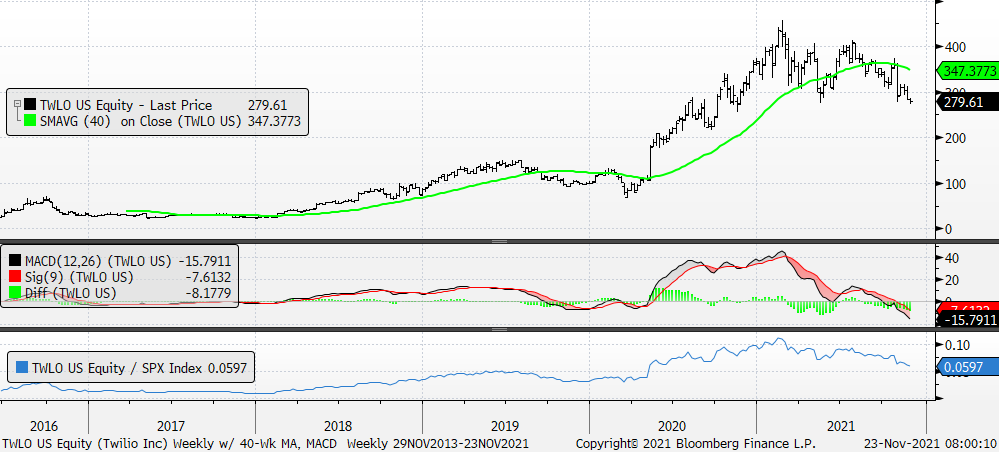
Twilio makes our “Weak Stock” list. Though already down a lot from its high we believe it works lower still. Risk to 200.