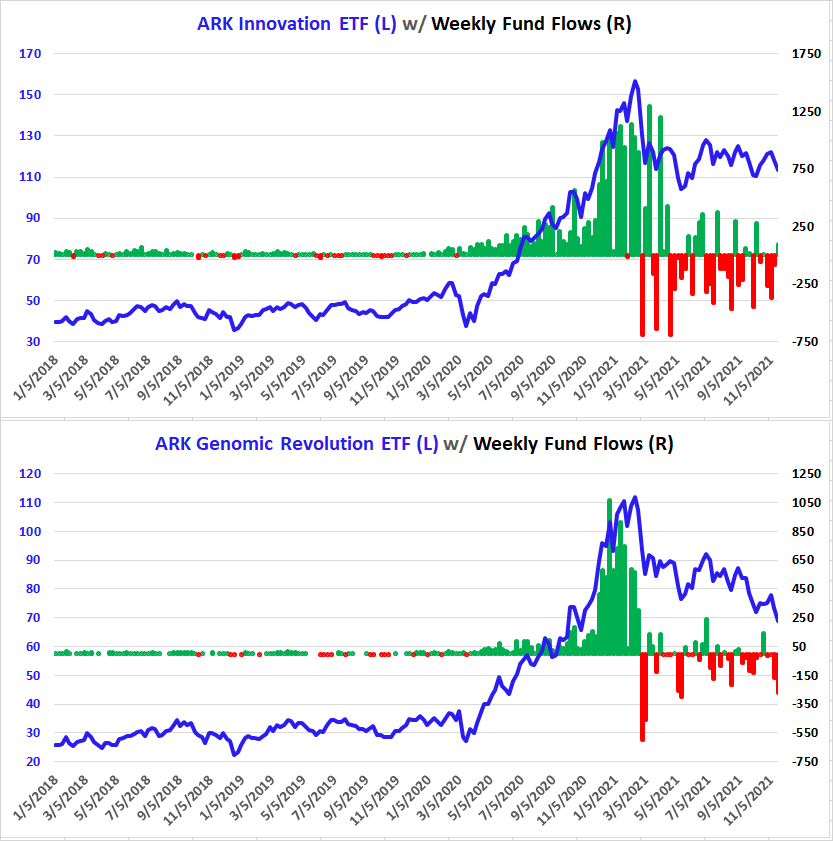
The charts below show the ARK Innovation and ARK Genomic Revolution ETFs (ARKK and ARKG, L) and their corresponding Weekly Fund Flows (R, green = fund inflows and red = fund outflows).
Technical action / price trends for the ARK Innovation ETF are weakening on an absolute basis and is bearish relative to the S&P 500 while the technical action / prices trends for the ARK Genomic Revolution ETF is weaker on both an absolute and relative basis when compared to the S&P 500.
As you’ve likely imagined, ARKK and ARKG had their greatest inflows from the autumn of 2020 – early 2021 but since early March flows, and our technical take on both ETFs, have been negative.
Since early March we’ve consistently wondered, “If ARKK is so great, why is its performance so unimpressive?” Price action has continued to inform us that ARKK and ARKG aren’t that great after all.