SUMMARY: Just About everyone we talked to during our London trip last week expected macro volatility to remain high into next year. We agree, but it is not necessarily bearish. Today’s Weekly is more important to internalize than usual when thinking through the current backdrop.
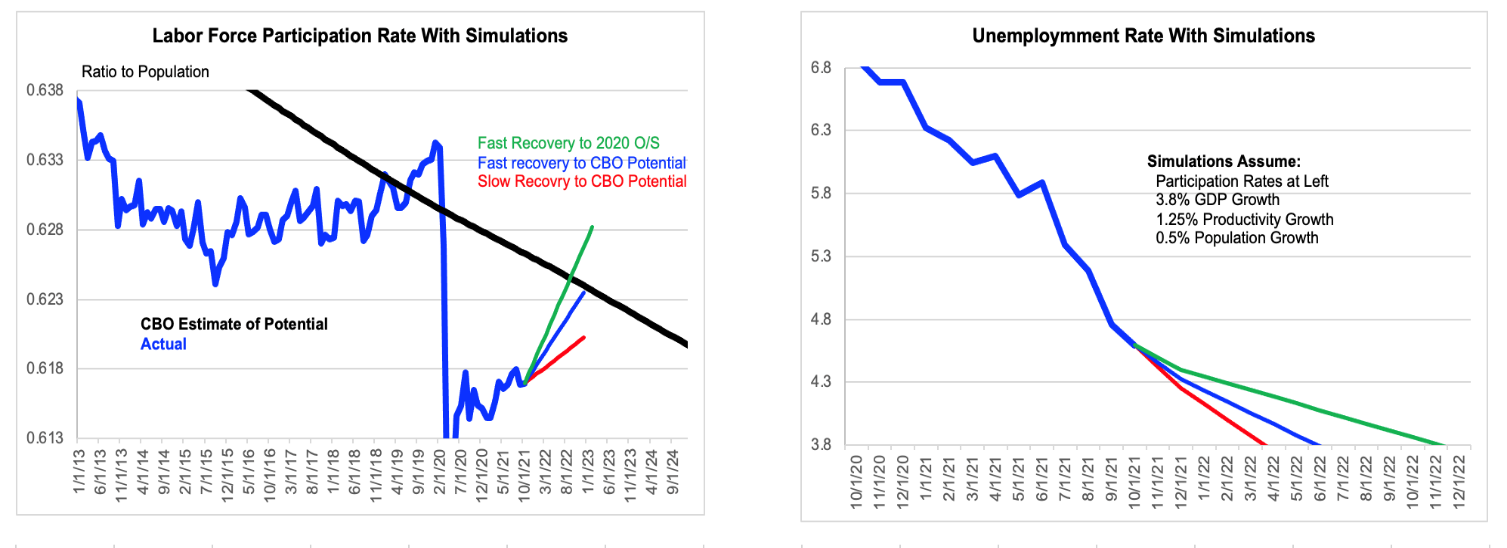
Gerard has done a good job of laying out the case as to why the skew is to the right on rates and core inflation. As he highlights, the 7-year compound inflation rate is within one high print of 2% (which we will likely get). That means the Fed will now tolerate, rather than prefer, above-2% inflation so long as there is labor market slack. Which is fine for equities and shouldn’t change the current estimated market pricing for Fed funds. That being said, barring a very strong recovery of the participation rate, the unemployment rate can easily fall below 4% by the middle to the latter part of next year. What is appropriate then? The last SEP suggests that the funds rate needs to go to 2.5% if the labor market achieves full employment and inflation is at target. Gerard is not suggesting 2.5% is a base case, but the point is important and it makes communication from the Fed very tricky early next year. Assuming participation doesn’t improve. Also, although the upward impact of owners’ equivalent rent (OER) should be discounted, the revised Zillow home/rent price data through October looks substantially stronger. Given OER is 17% of the core PCE deflator, this will be important to monitor.
Bottom line, expect volatility around all asset classes to remain high until we have a better handle on participation. Assuming participation doesn’t improve significantly and OER is biased higher, expect 2yr yields to have significant upward pressure in 2022. Even as headline inflation eases as supply chains clear up. The US demand outlook is still unusually firm (see regional PMI/retail sales data last week) and likely to remain so. Don’t look for inflation relief from softening demand. We have high conviction in the demand outlook (see details in the full report below).
Now the tricky part: If downside risk to China GDP growth continues, but U.S. core inflation is still biased higher, don’t expect the Fed to change their expected path of tightening. Unless equities correct significantly on China slowdown fears, in which case the Fed would react after the fact. While a sharp slowdown in China’s growth prospects remains a risk, expect yield curves to flatten. How much so will depend on how “risky” China is perceived to be. If China increases stimulus and the growth outlook improves, 10yr yields would have more upside risk.
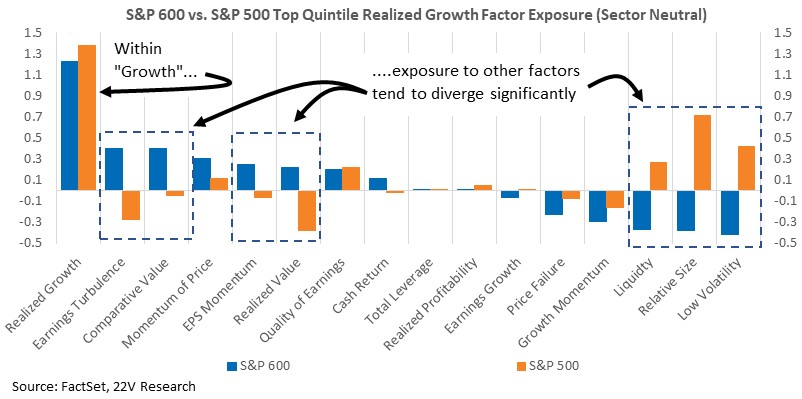
Uncertainty Impacting Internals: We just laid out a number of critical factors for the macro outlook; 1) participation rates, 2) China, 3) Rents, 4) Productivity. Participation rates, China’s growth outlook, productivity, and OER are all exceptionally hard to forecast. Supply chains are another wild card that are only moderately easier to forecast. Since clarity on most of those forces is not forthcoming, expect factor volatility to remain unusually high and for “safer” equities to outperform (TSLA and other highly idiosyncratic names not necessarily included) over the coming months. This has already started with high credit rating names vastly outperforming names with poorer credit ratings. Also, large-cap growth stocks have done well (Apple, Amazon, and Google are AA. Microsoft is AAA), but small-cap growth names have come under significant pressure. Small-cap Growth tends to have much higher Earnings Turbulence, Value, and Momentum rankings than large-cap Growth Tech. They also tend to be higher volatility and lower liquidity.
“Cleaner Trends”: We remain focused on micro trends that seem cleanest into year-end. Strong housing fundamentals and macro uncertainty anchoring long rates suggest Homebuilders continue to outperform. Strong US demand growth and easing supply chains favor Retail (and other industries. We can send the list). Pharma and other drug pricing sensitive names benefit from less drug pricing uncertainty overhang and relative insulation from macro uncertainty.
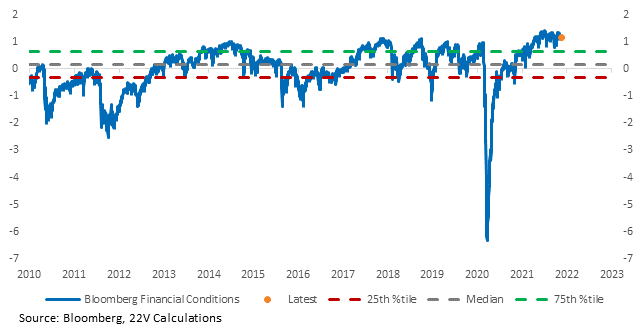
Not Bearish: Some might take all of the above as a reason to be negative on the market. But keep in mind that the Fed still wants financial conditions easy for NOW, which is helping keep credit spreads tight and real rates deeply negative. Plus demand growth is firm, S&P earnings and cash return are historically high, and the implied equity risk premium is still elevated longer term.
The most painful trade? FAANG plus TSLA driving the S&P up another 5% into year-end.
Full report below…
Inflation & Rates Skew: There is no longer a case for the Fed preferring sequentially above-2% inflation, although they may tolerate it as part of the balanced approach if labor market slack persists. The 7-year compound inflation rate is within one high monthly print of 2%.
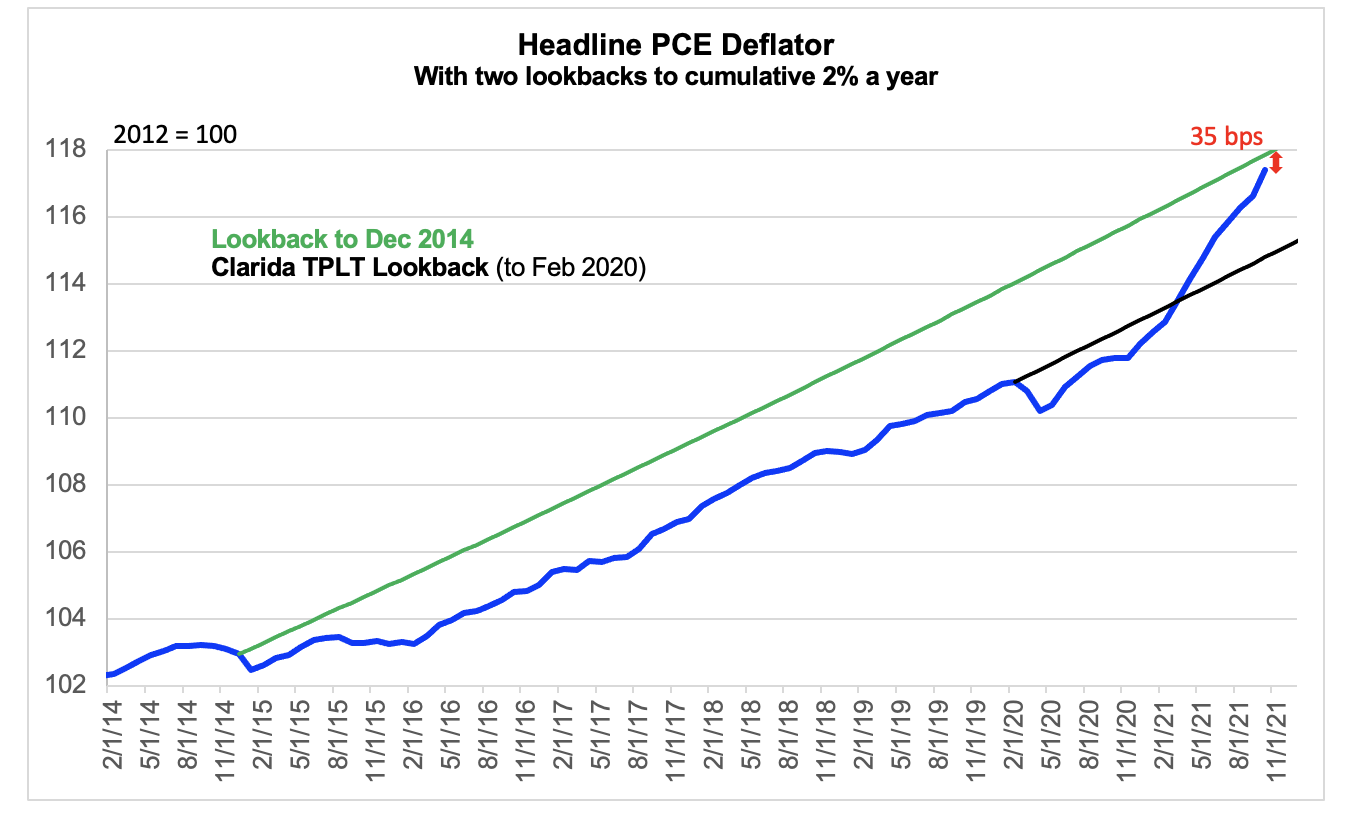
The Fed will now tolerate, rather than prefer, above-2% inflation so long as there is labor market slack. Barring a very strong recovery of the participation rate, the unemployment rate can easily fall below 4% by the middle to the latter part of next year. What is the appropriate policy rate if that happens? The last SEP suggests that the funds rate needs to go to 2.5% if the labor market achieves full employment and inflation is at target.
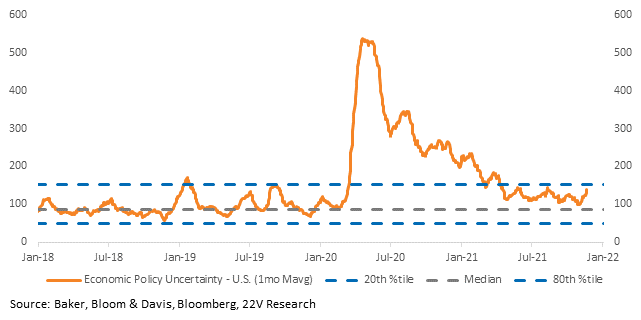
Yields are restrained by inflation and economic policy uncertainty. Treasury volatility is elevated and likely to remain so as investors debate the outlook, particularly for inflation. China is a major swing factor in the inflation and rates outlook as well.
Internals Impacted By Uncertainty: Inflation concerns have increased but credit spreads are still tight. Inflation or uncertainty concerns are showing up in internals though. High credit rating names are vastly outperforming names with poor credit ratings. The trend will likely continue while we have a period of chop as investors wait and debate inflation.
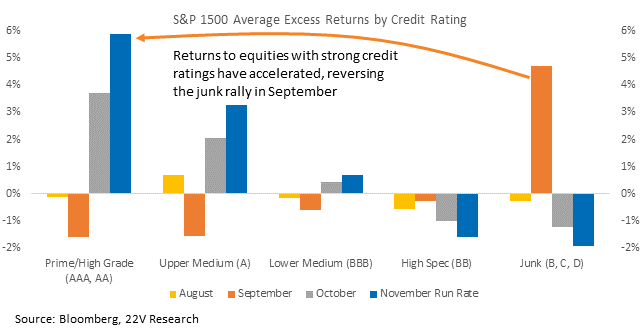
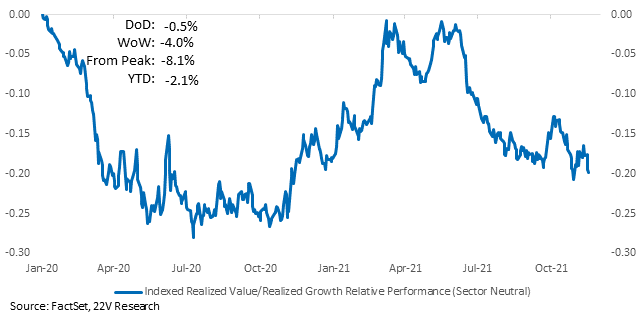
Apple, Amazon, and Google are AA. Microsoft is AAA. That helps explain the broad-based increase of Growth relative to Value.
“Growth” has become shorthand for a particular kind of stock (tech/biotech/new media/DeFi/ platform companies/etc.). There has been much discussion about small-cap “growth” breaking down relative to mega/large-cap growth names. From a systematic standpoint and when thinking about the macro forces that may be impacting returns to those names, it is important to examine what colloquial “growth” is from a factor standpoint. Some of those differences are mechanical (Size), but the others are important. Small-cap Growth tends to have much higher Earnings Turbulence, Value, and Momentum rankings than large-cap Growth Tech. They also tend to be higher volatility with weaker liquidity.
Financial Conditions Still Easy: Near-term downside risk to equities from rising core inflation should be limited by a few factors. 1) demand growth has been strong (see regional PMIs/retail sales) and will likely remain so into 2022, 2) Fed policy is still focused on maintaining easy financial conditions, and 3) the path of major inflationary forces like wage growth and productivity remains highly uncertain. A shifting Fed stance is a 1/2Q 2022 issues.
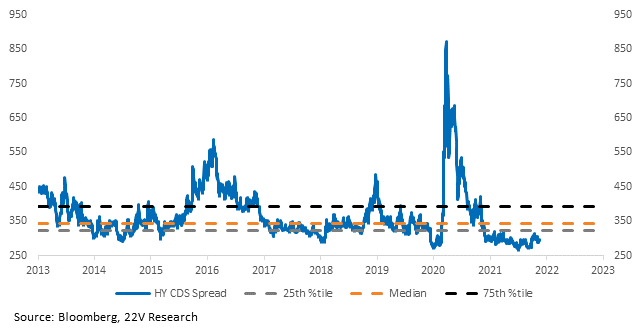
Inflation concerns have increased but credit spreads are still tight. Narrow credit spreads reinforce the Fed’s pro-growth stance, which is bullish for stocks and the economy LONGER TERM. If markets were pricing in demand destruction, credit spreads would be wider.
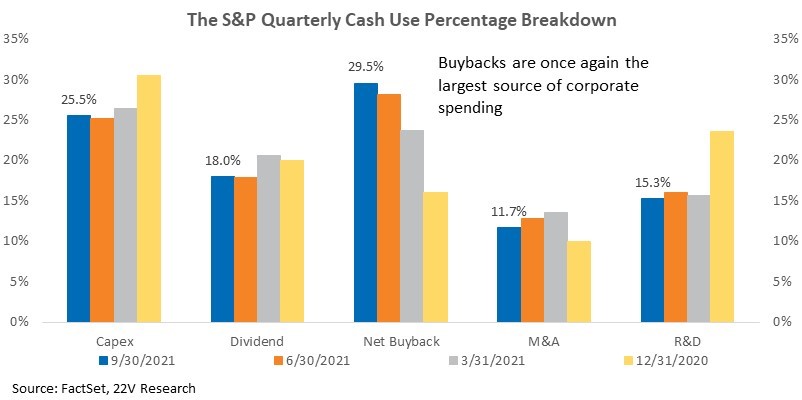
Fundamental Market Support: Surging cash returns is another important market tailwind. Capex rebounding is a support for the economic cycle and organic growth while buybacks reduce share counts, adding to inorganic growth. As we wrote last week, stronger than expected EPS growth in 3Q supported a 5% sequential and 54% y/y increase in S&P total cash use. Total spending by S&P companies reached $751bil. Capex rose 18% as companies invested to meet booming consumer demand, and net buybacks reached a new all-time high.
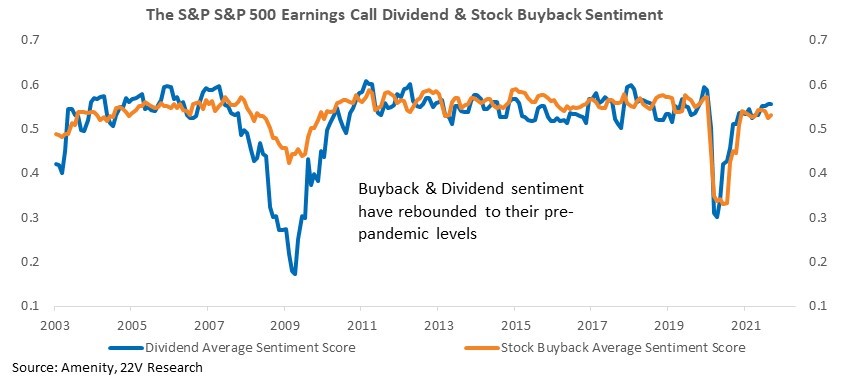
Management mentions of cash return, including dividends and buybacks, have also improved quickly. Net sentiment toward cash return categories, measured using the Amenity natural language processing tool, is back near its pre-pandemic level. Expect cash return to remain a large proportion of corporate spending over the coming quarters, boosting large-cap earnings and returns.
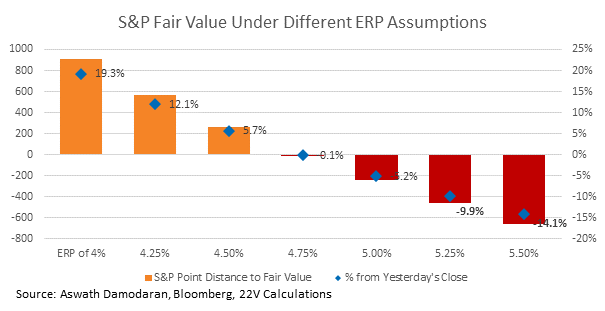
Equity Risk Premium Support for Equities: The S&P has moved closer to fair value. But fair value doesn’t turn negative under the current ERP unless the 10yr yields hit 3%. Upside increases if expected cash return improves (why rising dividend and buyback sentiment is important) and the ERP moves lower. The ERP was unusually high during the post-GFC regime. Now that we are exiting a long period of low inflation and slow growth, a normalization of the ERP seems reasonable.
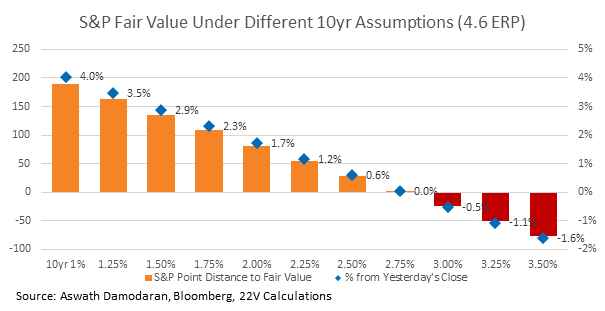
Upside increases as the ERP moves lower, which we expect. The ERP was unusually high during the post-GFC regime. Now that we are exiting a long period of low inflation and slow growth, a normalization of the ERP seems reasonable.
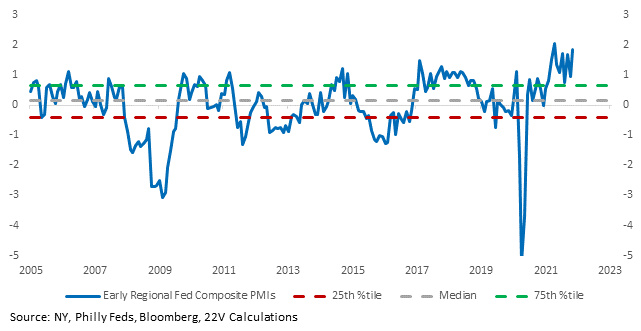
Demand Growth Firm: The Philly Fed Regional PMI beat expectations resoundingly, following the Empire survey. The KC Fed PMI missed. An aggregation of the early regional Fed PMIs shows overall activity is robust. Capex intentions and new orders were particularly good. Demand and leading indicators are still strong, supporting longer-term equity performance despite poor sentiment and overall uncertainty.
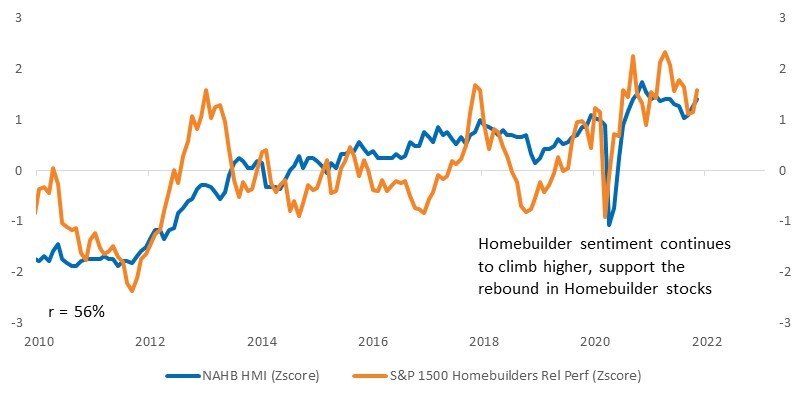
HOUSING SUPPORT: As we detailed in late October, housing remains a strong economic support. NAHB HMI came in at 83 (est 80, 80 last) and future single-family sales rose to 84 (highest since Dec). Homebuilders have rallied recently despite the backup in bond yields and weak consumer confidence readings (headline and “good time to buy a house” questions).
Mortgage rates increased modestly last week, but the mortgage spread remains exceptionally low. As the WSJ reported, Fannie and Freddie are set to increase the limits on mortgages they buy with “a baseline level of about $650,000 in most jurisdictions and to just under $1 million in high-cost markets.” Housing finance requirements are adjusting to support the rise in home prices.
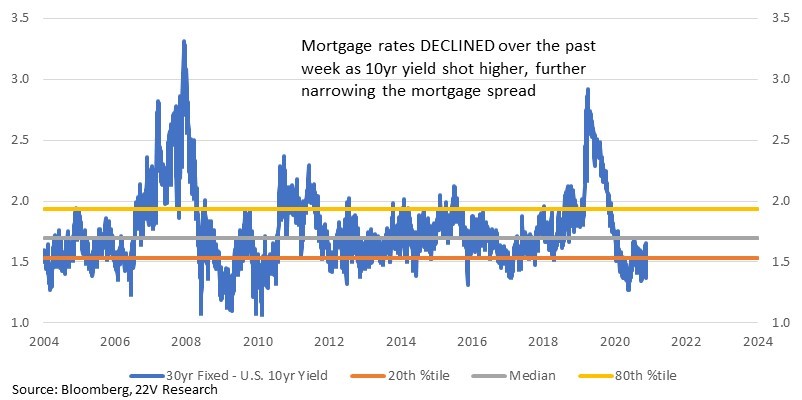
Low mortgage rates are a large part of the reason affordability has remained high over the past two years even as the national average home price has increased nearly 28%. 30yr fixed mortgage rates are still sitting near 3%, which is the 5th percentile of their historical range (1975-fwd).
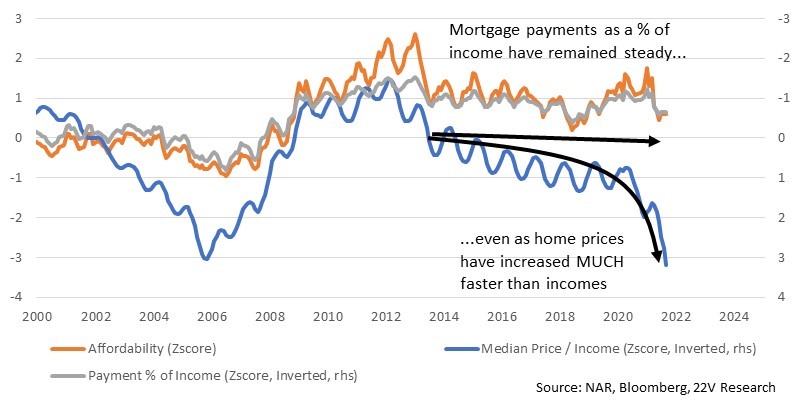
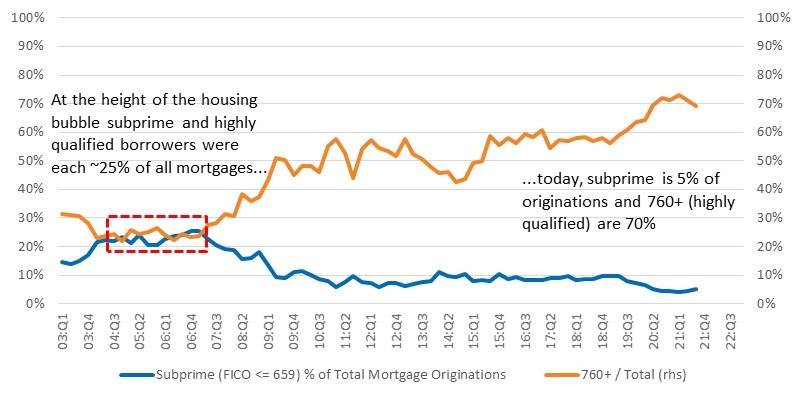
Home price gains have outpaced income gains by a wide margin. The last time the Home Price to Income ratio was this high was in 2006. Things did not go so well after that. But there are CLEAR differences between now and the housing crisis. In 2006/7 about 25% of mortgages went to highly qualified borrowers and another 25% were subprime borrowers. Today, subprime borrowers make up just 5% of mortgages while consumers with FICO scores above 760 make up 70% of originations.
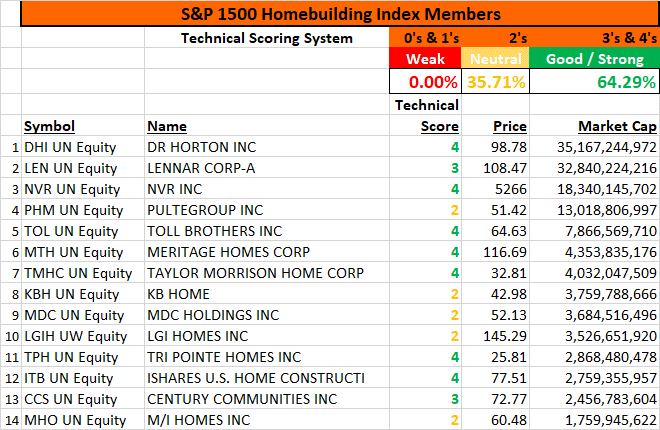
Homebuilders remain one of our favorite industry groups and are a prime example of the micro-trends theme (macro is fading as a market driver, but macro forces are important for micro trends). Below are John Roque’s rankings for the S&P 1500 Homebuilders.
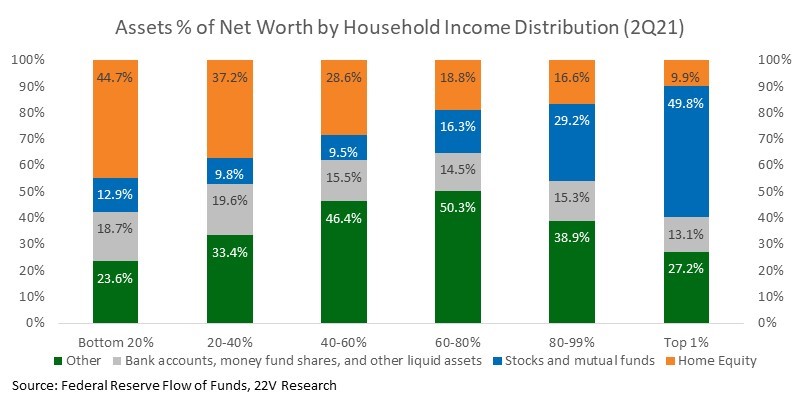
One last point on the housing market. October Retail sales were much stronger than expected (1.4% vs. est 0.7%) leading to head-scratching about the divergence between actual spending (strong) and sentiment (weak and falling). Supply chain and inflation news sentiment are likely weighing on the consumer outlook while the strong jobs market is supporting actual spending. Another concept to keep in mind is the run-up in home prices. Home equity is the single largest asset of most families in the bottom 40% of the U.S. income distribution. That asset has appreciated massively over the past few years.
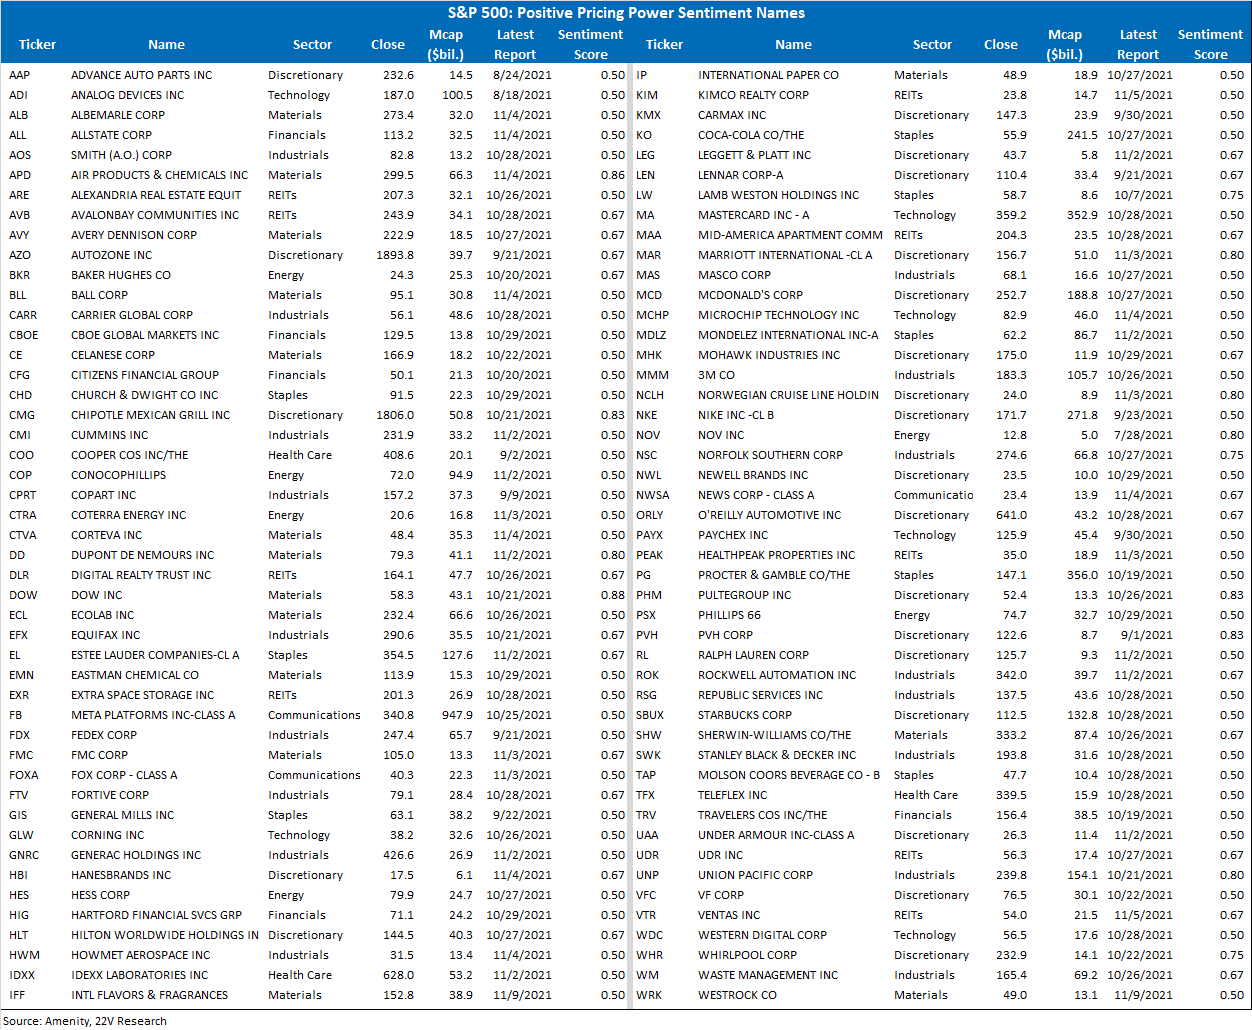
Pricing Power: We built a pricing power portfolio using Amenity’s natural language processing tool. The portfolio contains stocks where management expressed the most positive sentiment about pricing as of the end of 3Q. This is a good list to focus on as the inflation debate causes concern over profit margins and the EPS growth outlook. Constituents are at the end of the report. The portfolio has underperformed recently, suggesting some easing of the emphasis on pricing power.
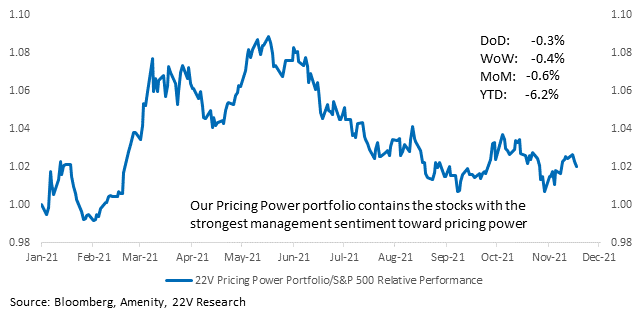
Pricing Power Portfolio constituents are below.