Our entire repository of COVID charts is HERE.
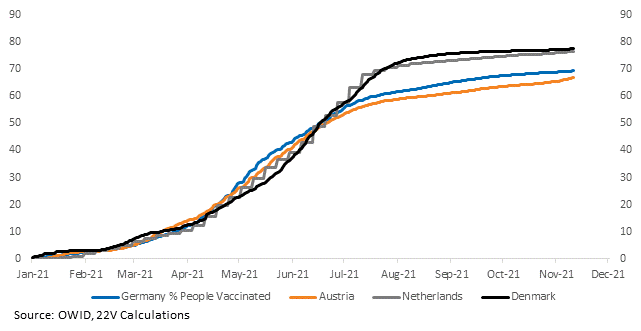
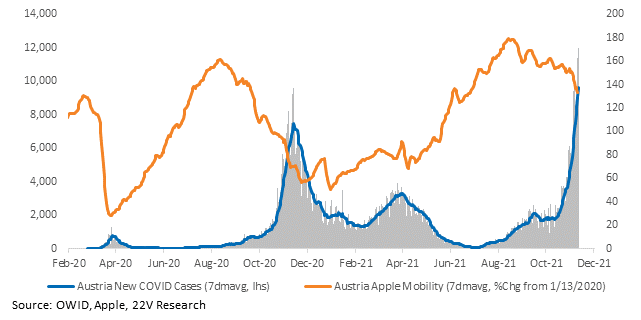
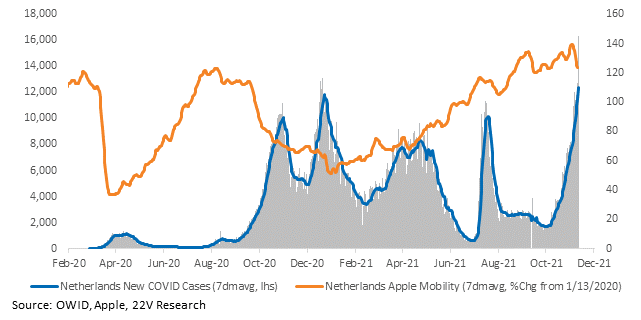
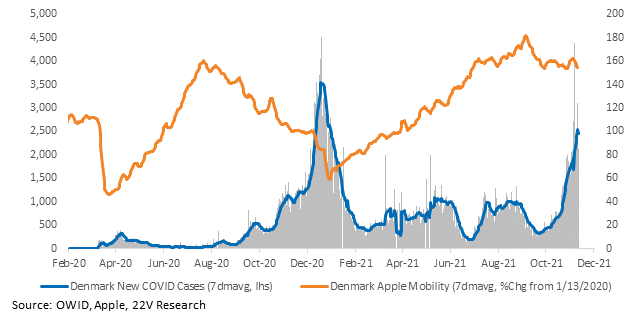
Case growth is increasing across Europe and a number of countries are reinstituting forms of lockdowns (useful aggregation here). The Netherlands, by far the most stringent, is set to announce curfews at bars, restaurants, and shops and limits on gatherings (despite its 82% vaccination rate). Austria is imposing lockdowns on the unvaccinated. Denmark is reinstating proof-of-vaccination cards. Germany is ramping up testing and canceling large events. We would note that the lockdowns are troublesome but are not like the lockdowns in 2020 and early 2021. Oxford’s response tracker is particularly useful here in looking at objective scores for restrictions vs watching headlines (first chart).

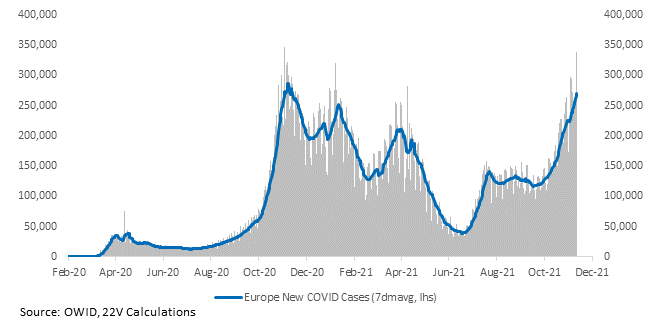
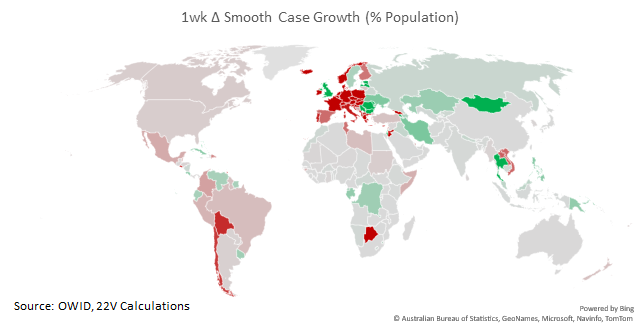
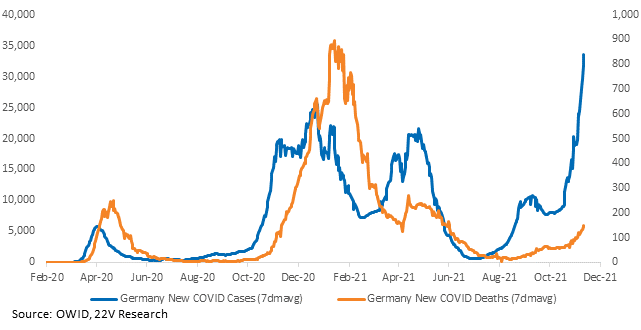
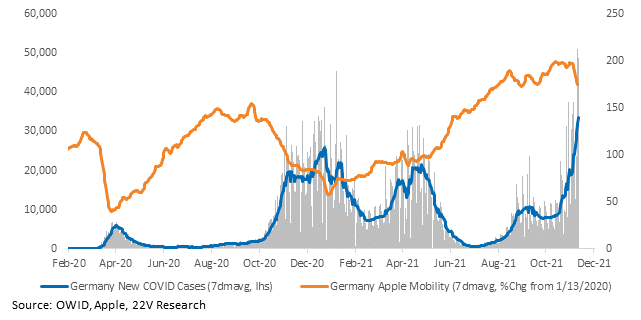
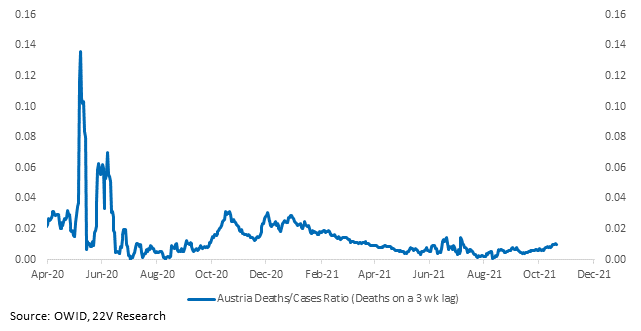
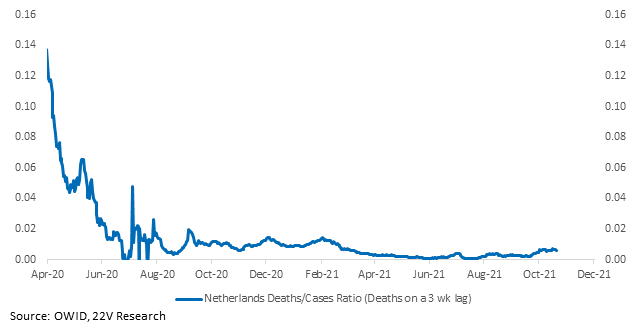
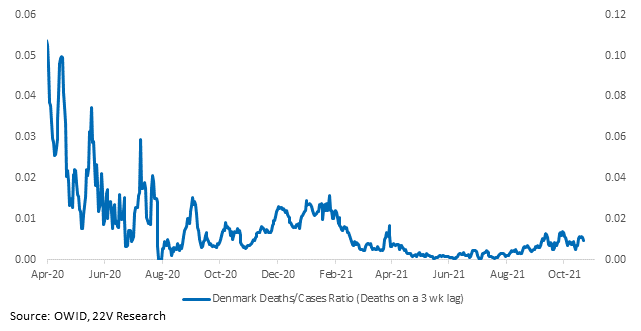
Vaccination rates still help. Look at the difference in the ratio of deaths to cases in 2H21 vs 1H21 and 2020. Activity should remain elevated as vaccinations decouple case growth from severity, as long as governments don’t impose radically stricter lockdowns. Booster shots and child vaccines, which are being rolled out, will help. There is no evidence to suggest this wave is overwhelming vaccines. Mobility is still high across Europe, though declining. FYI, mobility metrics will fall cyclically during the winter. Case growth and vaccination rates are worse in Eastern Europe, but lockdowns are less likely there and less impactful on the global economy, although the human impact is not forgotten. Lots of country charts below and the rest of our country charts can be found HERE.
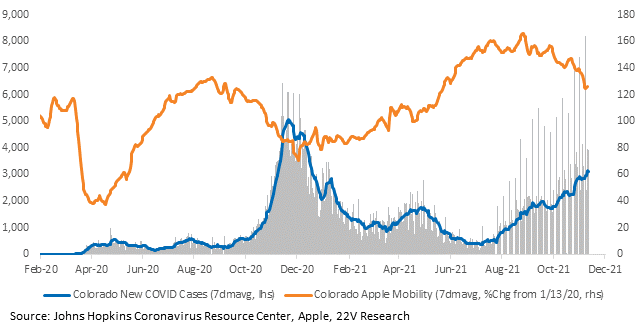
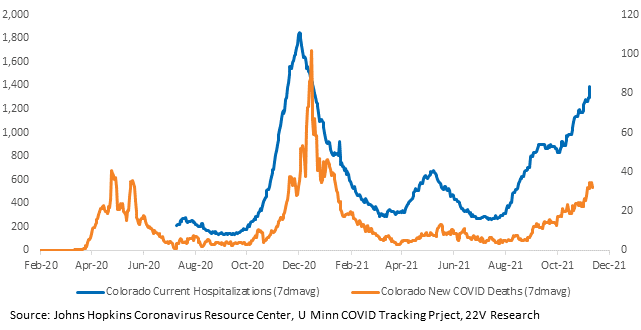
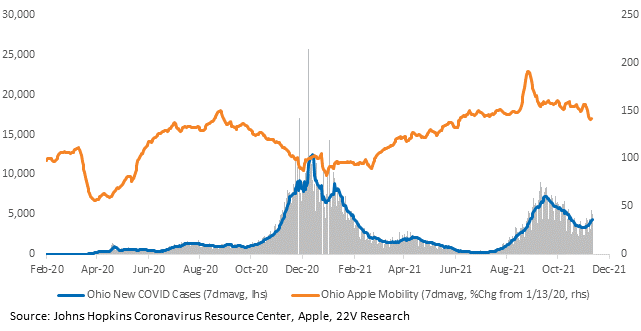
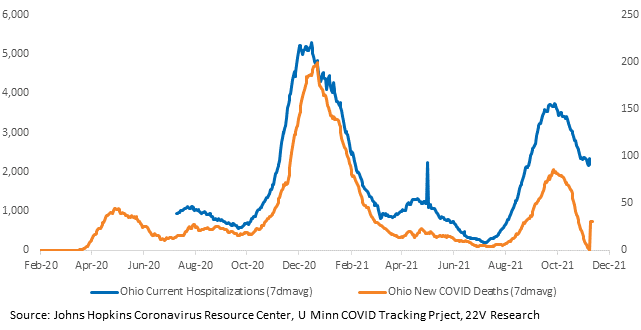
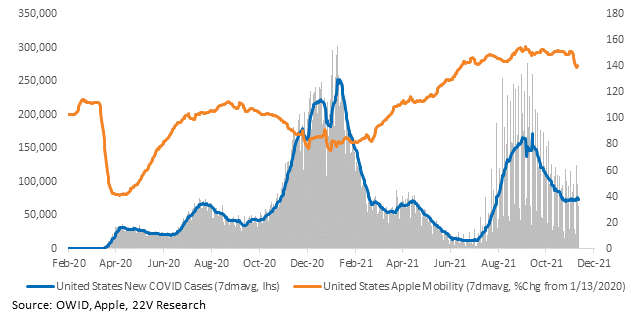
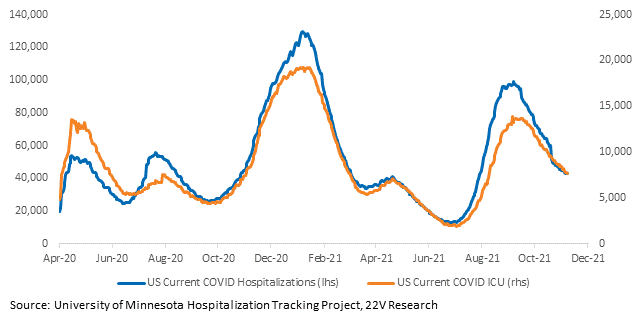
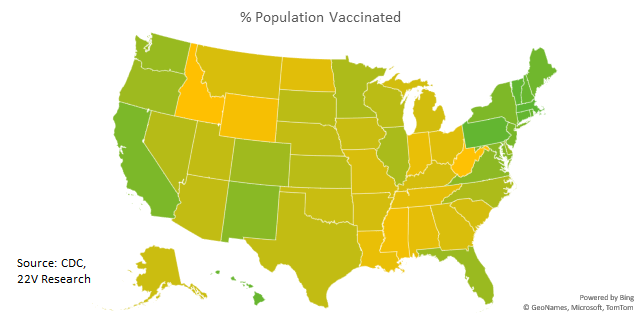
Case growth in the U.S. is stagnant. Net hospitalizations and ICU admissions are still declining. Mobility is lower but will decline cyclically into the winter. Case growth is concentrated in the Mid and Mountain West, which has poor vaccination rates and not many people.
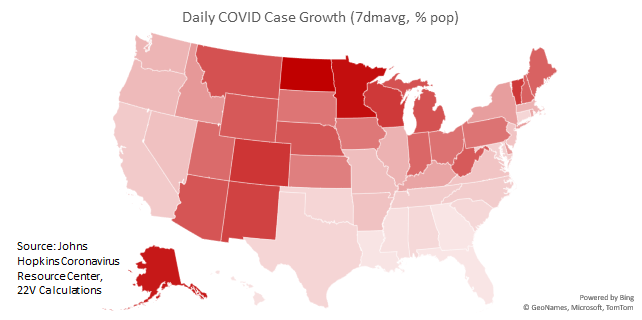
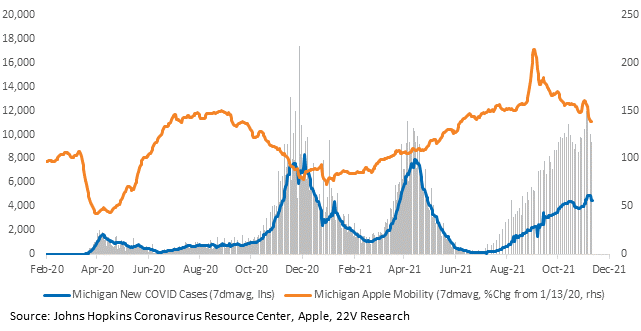
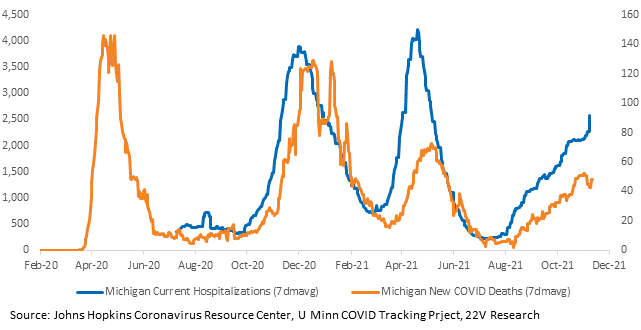
Case, hospitalizations, and deaths in the states with the worst case growth are highlighted below. Charts for every state and country we have data for are HERE.