Bread and Circuses (Panem et Circenses)
The phrase “Give them bread and circuses and they will never revolt” is reputed to have come from the Roman poet, Juvenal (1st – 2nd century AD). His message was an observation of what Roman politicians were giving their citizens to avoid any possible rebellious actions by the mob who were, therefore, fed, entertained, and restrained.
Currently, with eyes glued to their phones and desirous of their tribal networks’ affirmations the masses are equally entertained, and you only need to consider the latest Musk-ian saga for confirmation. Musk launched a Twitter poll last Saturday where he said, “Much is made lately of unrealized gains being a means of tax avoidance, so I propose selling 10% of my Tesla stock. Do you support this?” 58% of the 3.5 million respondents voted, “Yes.”
A related issue has Elon’s brother, Kimbal, selling 90,000 Tesla shares on Nov 5 – one day before his brother’s infamous Tweet. If you think such action might raise a few questions at the SEC, you can rest assured those folks are looking at their own phones, not paying attention, and consider it a mere slice of the zeitgeist that the market cap for the Shiba Inu cryptocurrency is greater than the GDP of Albania. It’s funny, but it’s not a joke.
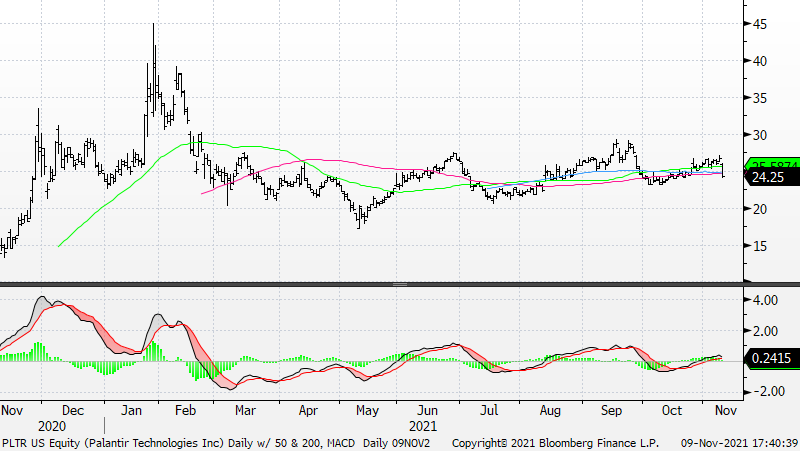
Musk, Elon and not Kimbal, said he would “abide by the results of the poll, whichever way it goes” and TSLA was down 5% on Monday and 12% yesterday. Such a poll reminded us of the scene(s) in Gladiator where the emperor Commodus (Musk) gives the “turned thumb” based on the bloodlust of the Colosseum’s crowd (Twitter). The following painting by the French artist Jean-Leon Gerome, from 1872, entitled “Pollice Verso” (“with a turned thumb”) is thought to have brought the gesture into the public’s consciousness. FinTwit gave a “thumbs up” to Musk’s question which turned out to be a “thumbs down” to the stock. After rising 60% in 25 days where its market cap surged from $777B – $1.235T and it became the fifth biggest stock in the S&P and NASDAQ, TSLA was – and still is – overbought on a daily, weekly, and monthly basis despite declining about 17% in the last three days.
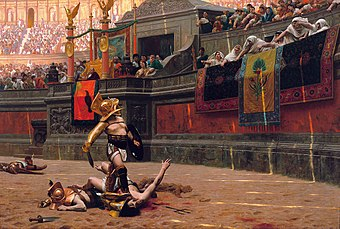
Tesla broke out above 780 in late September / early October implying a target of 985 and then a bigger breakout occurred above 900 – with an upside gap – on Oct 25 and that suggested a target of 1225. The stock got to 1243 but there was no way to know that would mark an interim peak. If Tesla pulled back another 12% to 900 it wouldn’t be extraordinary from a chart perspective, but it might be extraordinary in this environment.
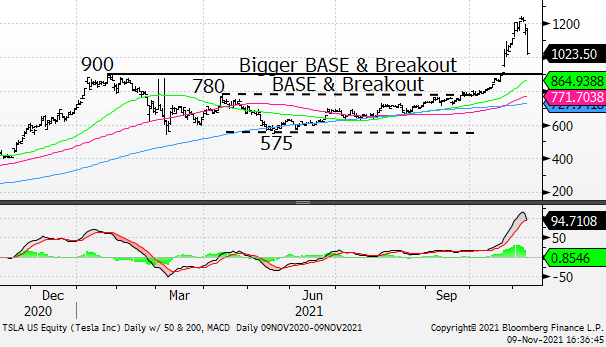
PPI data from yesterday showed a year / year rise for October of 12 ½%, the highest annual rate of change since October 1980 (that is not a typo). Further, the 12 ½% figure was the 8th month in a row where the PPI printed year / year results of at least 6%. For those keeping score at home, the last three months had August at 10 ½%, September at 11.8% and October at 12 ½%. While the Bank of England governor, Andrew Bailey, has said that he is “very sorry” UK inflation is rising amid forecasts that the cost of living could reach as much as 5%, Jay Powell continues to double-down. Powell recently said, “Transitory is a word that people have had different understandings of. For some, it carries a sense of ‘short-lived,’ and that there’s a real-time component, measured in months.” He went on to say that, for the Fed, it’s not so much a measurement of time — but rather a question of whether the current trend of rising prices will lead to “permanently or persistently high inflation.” Seems to us that Jay “doth protest too much.” We’d guess that many of these higher prices we are all paying are now embedded and won’t be retracted.
The chart below shows year / year changes for the PPI back to 1950 with the red line representing our “Transitory Indicator.” It’s not an indicator at all for all we did was count the number of consecutive months that the PPI has printed a figure of at least 6% and, as noted above, we’re currently in an 8-month cycle. Prior longer cycles of “transitory” inflation occurred for (a) 11 months from Oct ’50 – Aug ’51, (b) 34 months from Mar ’73 – Dec ’75, (c) 59 months from Mar ’77 – Jan ’82, and (d) 12 months from Oct ’07 – Sept ’08.
The S&P had troubles in three of those four periods. For example, in the only non-suffering cycle the S&P gained 18% from Oct ’50 – Aug ’51. But, in (b) the S&P was down 22% from Mar ’73 – Dec ’75 (from Jan ’73 – Oct ’74 it lost 48%), in (c) the S&P was down 11% from Mar ’77 – Mar ’78, rallied 61% from Mar ’78 – Nov ’80, and then another decline of -27% from Nov ’80 – Aug ’82, and in (d) the S&P was down 29% from Oct ’07 – Sept ’08 which was part of a bigger bear market that saw the S&P drop 57% from Oct ’07 – Mar ’09.
The S&P is up 18% in this higher inflation regime we’ve experienced from Mar ’21 to date just like it was in (a) above.
We don’t think the Fed’s going to raise rates (“…not no how” as the gatekeeper to Oz told Dorothy and her intrepid trio), but it is interesting to us that as rates have weakened commodities have stayed firm. We continue to believe the release valve for inflation is the commodity market.
The following few stocks are “technical” concerns:
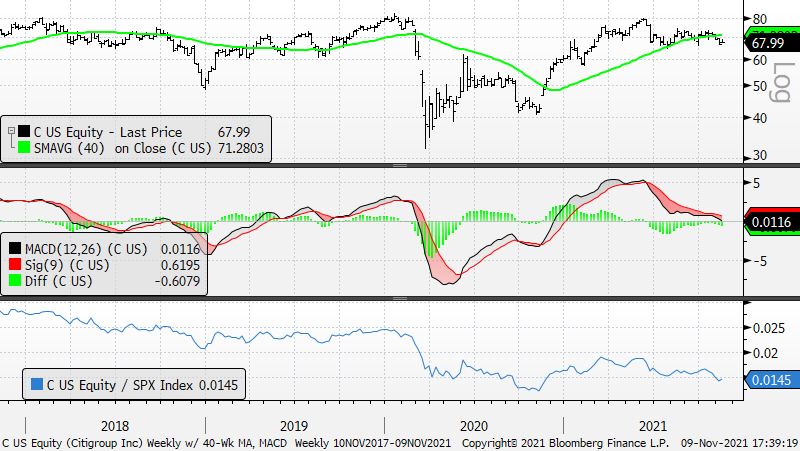
(1) Citigroup (C) – Though up 10% in 2021, the stock is a big laggard relative to the S&P Financials, the KBW Bank Index (BKX), and the S&P 500. Too, the stock is at the same level as in mid-Jan ’21 and weekly momentum is thisclose to moving into negative territory. If the environment for banks has been so good, why is C weak?
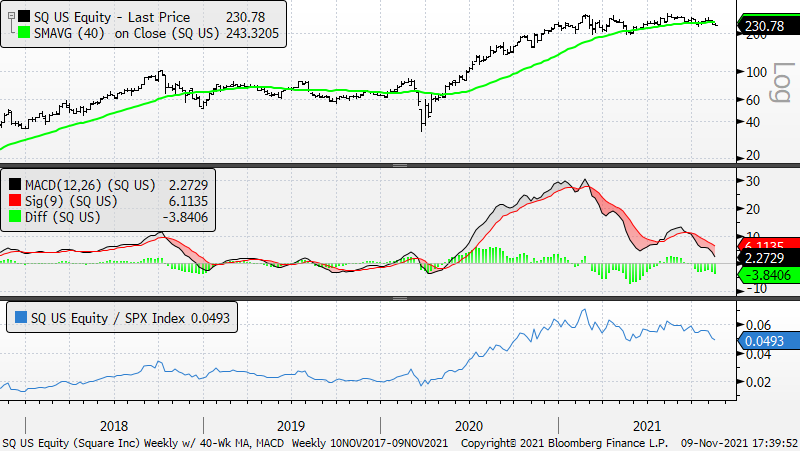
(2) Square (SQ) – Distributive / topping pattern: SQ is at a level first seen in Dec ’20 and has gone sideways – sometimes in a volatile manner – for 11 months. Such action brands it as a market laggard. In fact, looking at SQ relative to the S&P 500 makes the case for a top on a relative basis, too. SQ is testing its May ’20 relative support level vs. the S&P 500. Below a slowly cresting 40-week / 200-day moving average: It’s not always the case, but the slope of the 40-week / 200-day moving average represents the demand line for the stock. Stock price action above an upward-sloping 40-week / 200-day moving average suggests that demand is > supply while stock price action below a cresting 40-week moving average / 200-day moving average suggests that supply is starting to overwhelm demand. Daily momentum and weekly momentum are punk and monthly momentum – which peaked in August – is now cresting and in deceleration mode. The ETFMG Prime Mobile Payments ETF has weakened sharply of late with heavyweight components like Mastercard, Visa, Paypal, Fidelity National, Fiserv, Global Payments and FleetCor under a lot of pressure. It would be odd to us to see SQ avoid a similar fate.
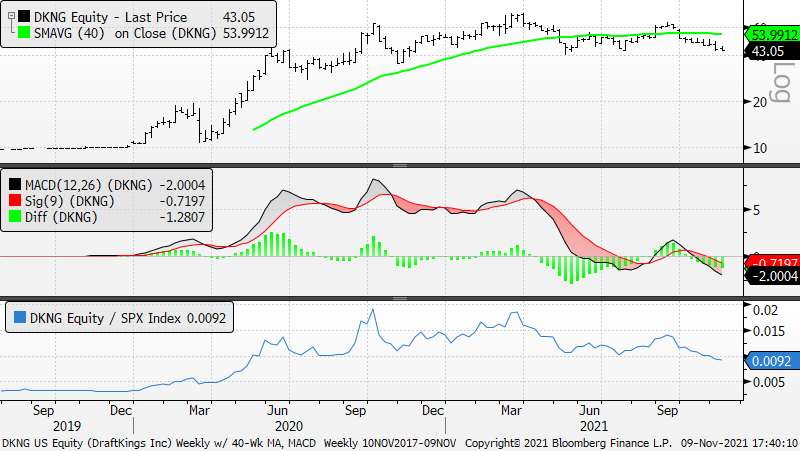
(3) DraftKings (DKNG) – Distributive / topping pattern: DKNG is at a level first seen in June ’20 and has been sideways with a lot of volatility since (-39%, -46%, -46%, and -34% currently). There’s support at 40 but we don’t think it holds.
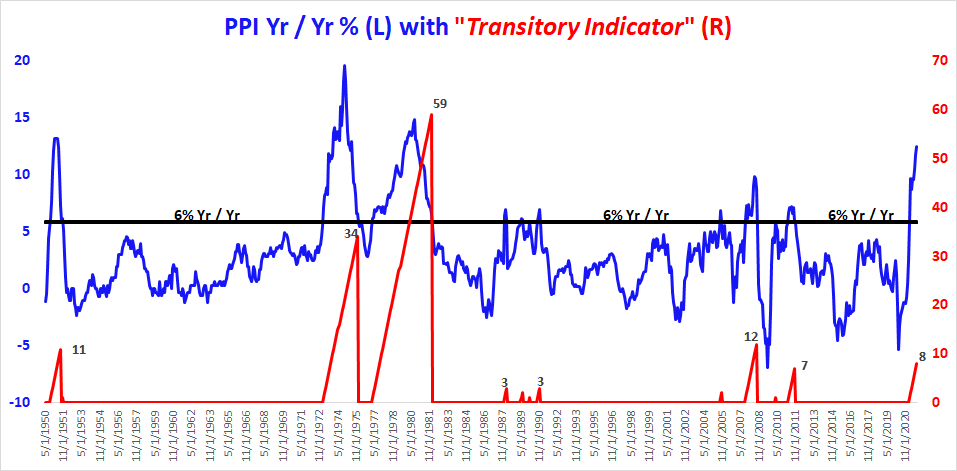
(4) Palantir (PLTR) – Momentum is softening on a daily and weekly basis and the stock has been blocked, in the high 20s, a la Dikembe Mutombo three times in a row. We think it has risk to 20.