92 on Your Periodic Table

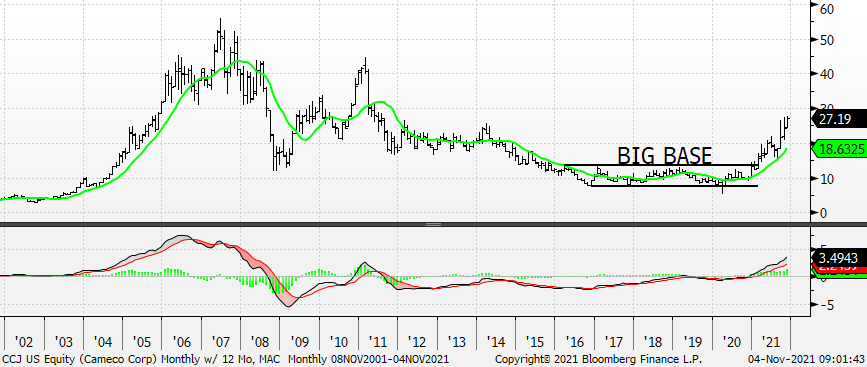
Truth be told, we’ve been sharing our Uranium Miners Index for a little while now, but our interest all started with making Cameco (CCJ) a part of our Global Miners Index. It didn’t hurt, of course, that in December 2020 Cameco completed a more than 5 ½ year BASE. The BASE and breakout at that time, above $13 – $14, implied a technical target of $30. The stock’s $27 today and we’re still looking for that $30 target.
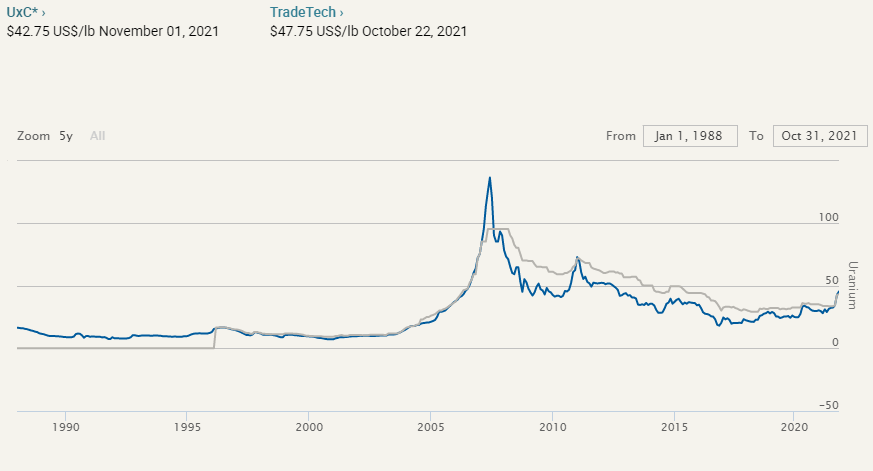
We’re fond of the Paul Tudor Jones’ line, “Price turns and then a narrative follows,” because as CCJ has moved higher the whispers about potential nuclear demand / short Uranium supply have become more frequent. And it probably won’t hurt our idea / this theme knowing that, according to Bloomberg, “China’s Climate Goals Hinge on a $440 Billion Nuclear Buildout.” The chart below shows both the Uranium Spot Price and the Long-term Uranium Price. Suffice it to say that if the lines on this chart represented stock prices, and not Uranium, we’d be buyers. We’re buyers of Uranium, too.
(chart below is from Cameco’s website)
High Technical Scores across the board for the stocks in our Index.
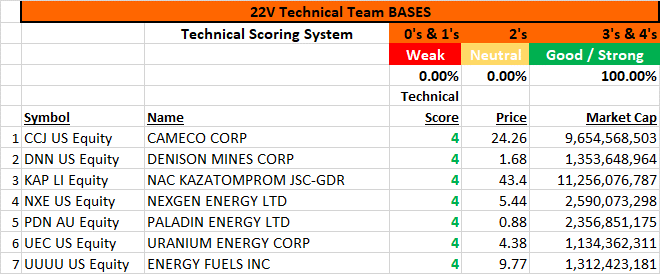
Source: 22V Technical Research
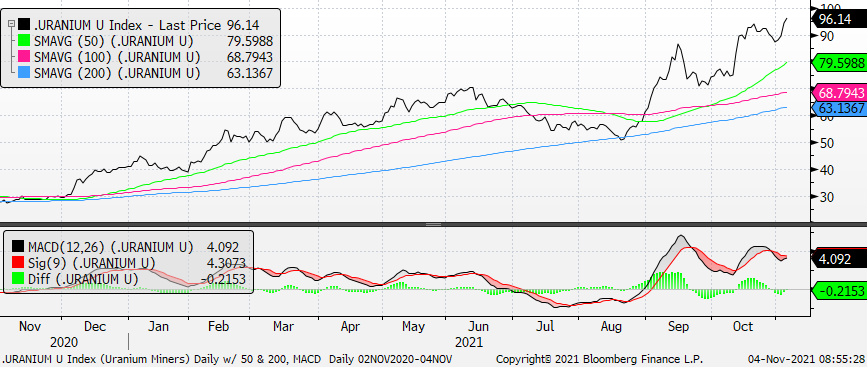
22V Uranium Miners Index – Daily chart w/ and Daily MACD
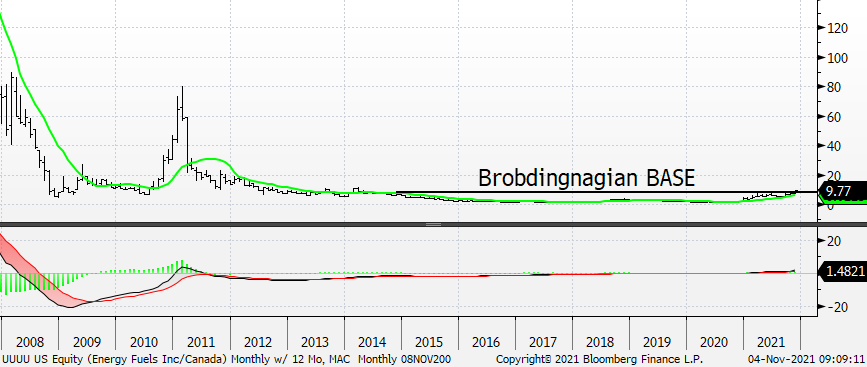
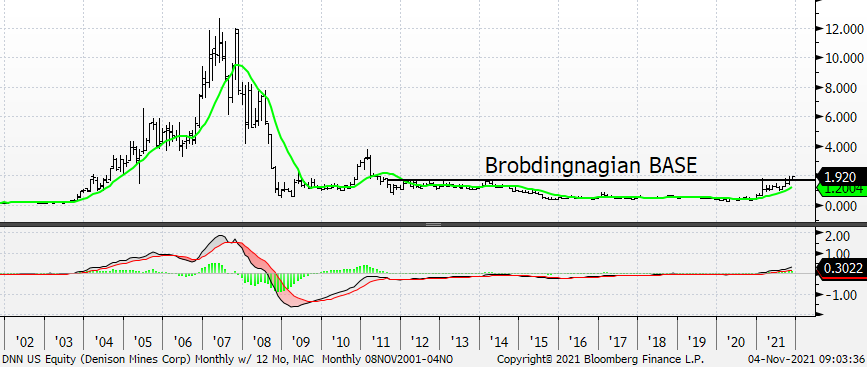
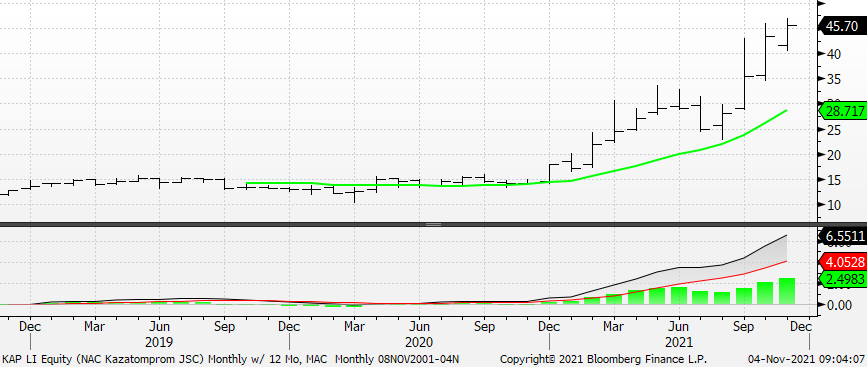
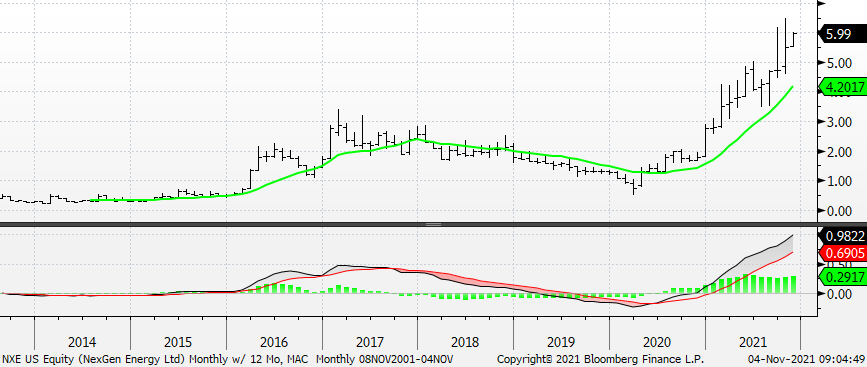
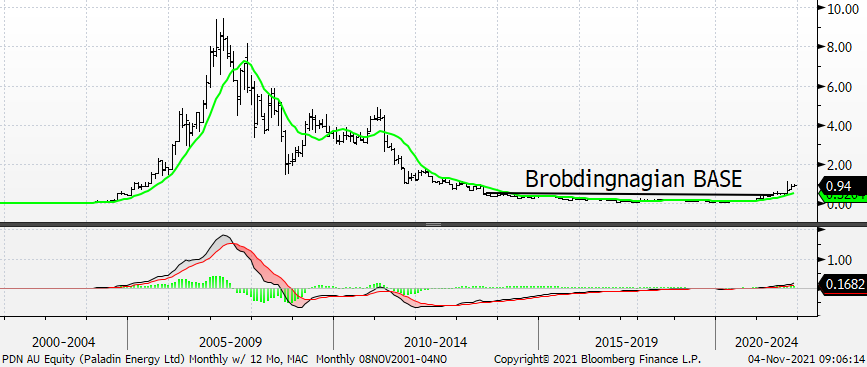
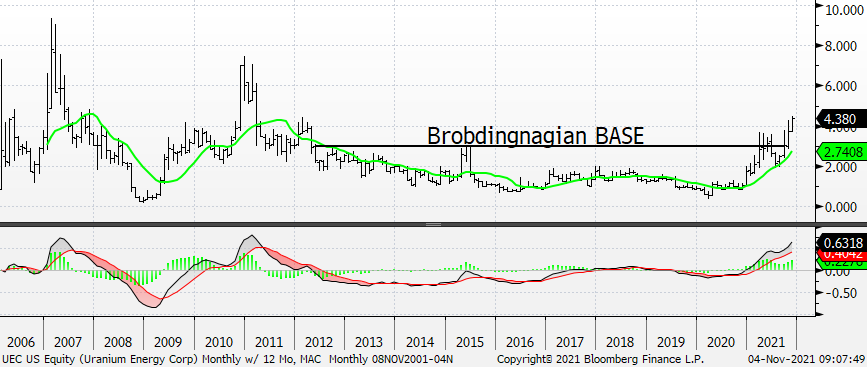
 Long-term charts for our stocks follow. They’re all Big / “Brobdingnagian BASEs.”
Cameco – Monthly w/ 12-Month Mov Avg and Monthly MACD
Dennison – Monthly w/ 12-Month Mov Avg and Monthly MACD
Kazataprom – Monthly w/ 12-Month Mov Avg and Monthly MACD
NexGen Energy – Monthly w/ 12-Month Mov Avg and Monthly MACD
Paladin Energy – Monthly w/ 12-Month Mov Avg and Monthly MACD
Uranium Energy – Monthly w/ 12-Month Mov Avg and Monthly MACD
Energy Fuels – Monthly w/ 12-Month Mov Avg and Monthly MACD