
The Land that Most Investors Forgot
Earlier today we sent out our note, “The Indexes Formerly Known as Hate” and asked this question:
“What has been / is the most hated global index?” Investor conversations over the years have confirmed to us that there are only two real answers to this question: (1) the SX7E – Euro STOXX Banks Index and (2) the Nikkei 225. We’ve poked fun at this concept for years and have said that if the SX7E had an alternative Bloomberg symbol it would be HATE. And even if it’s not hated, the Nikkei is the World’s Heavyweight Champion for “The Index that Most Investors Forgot.”
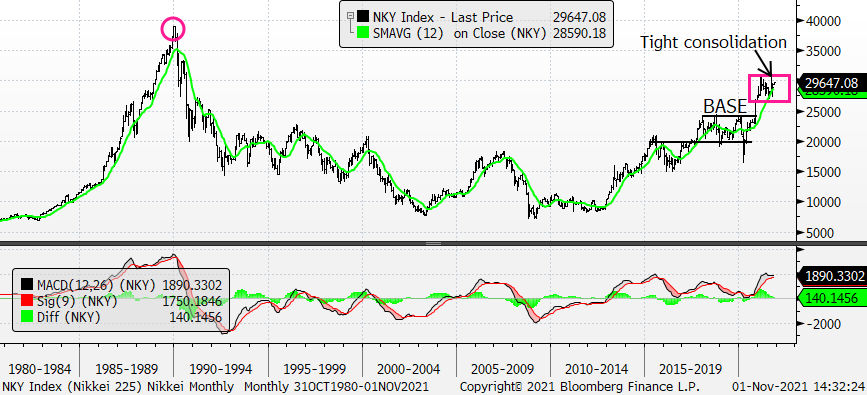
That’s been generally true about the Nikkei 225 (and Topix) for more than a generation and nothing much changed despite the breakout above 24000 for the Nikkei in November 2020. It was at that time that we said the Nikkei will make a new all-time high in this cycle. The Nikkei’s former all-time high was at the 39,000 level and it occurred in 1989. It wasn’t coincident, of course, but it was in the mid-80s when – and as Casey Stengel used to say, “You can look it up…” – the land under the Imperial Palace was worth more than the entire state of California. Real estate in Japan was selling for 350X what the equivalent space was selling for in Manhattan. It’s an understatement to say that it took a long time for Japan to work through its excessive valuation.
We’ve been told for a long time now that “Japan is cheap” and “it’s not unusual to find companies in Japan who have cash balances exceeding their market cap.” It’s a huge plus, you’ll agree, when technical / price action and valuation are in accord.
The Nikkei is up 8% and the Topix 13.3% in 2021 and in US$ the numbers are -2.2% and +2.6%, respectively. Pricewise, the Nikkei peaked in Feb ’21 and has been sideways since while the most recent peak for the Topix was in Sept ’21. It’s safe to say that both indexes have been sideways and consolidating or BASING for most of 2021. The market’s internal action has been stellar as 90% of Topix Groups are up in 2021. We’ve reviewed a boat load of Japanese stocks via our Technical Scoring System and are happy to share our results. In the meantime, the monthly charts for both the Nikkei and Topix should reinforce our idea that both indexes will make new all-time highs in this cycle. Especially the 30+ year Brobdingnagian BASE for the Topix.
Nikkei 225 – Monthly w/ 12-Month Moving Average and Monthly MACD
Topix – Monthly w/ 12-Month Moving Average and Monthly MACD


