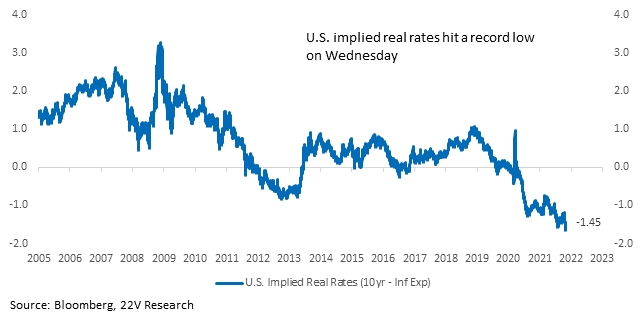
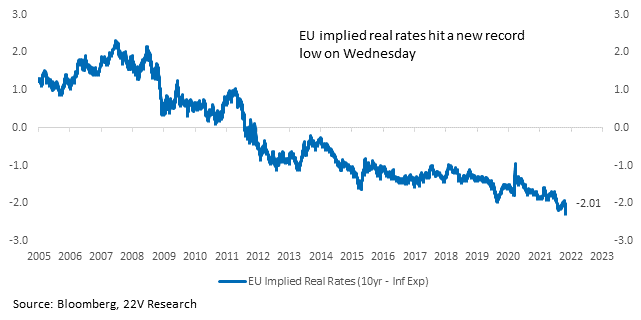
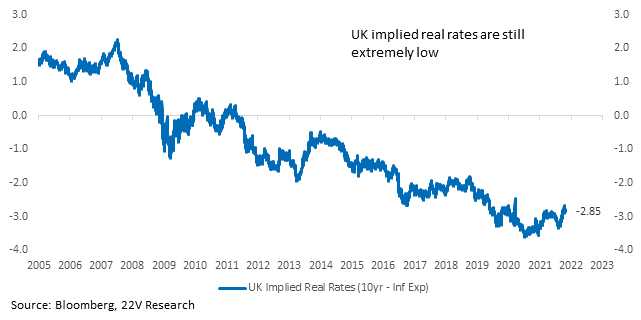
SUMMARY: The yield curve move last week is a concern, but keep in mind that implied real yields are deeply negative in the U.S. and fell to a new record low last week (-150bp). In theory, the US backdrop is becoming MORE, not less stimulative as a result. European real implied yields are at a record low (-201BP) and the UK is just off record lows (-285bp). Its tough to be short risk assets and Cyclicals in general, longer term, with such negative real yields.
Short Term Vol Likely to Continue Though: As Gerard highlighted in a report today, “the Fed has been a friendly influence on risk asset prices over the past twelve years but is becoming progressively less so as the months pass this year. It is probably no longer appropriate to describe the Fed as on balance friendly. Even its own influence is now quite data dependent.” If Powell notes this week 1) that he expects inflation to fall and as result doesn’t expect to raise rates in 2022 (dovish), but 2) the FOMC will respond to inflation with tighter monetary policy (more policy flexibility), fixed income volatility should stay elevated. That is a function of the world thinking there is upside risk to inflation (see how short rates reacted to Lagarde’s comments on inflation falling and the ECB remaining dovish. The market didn’t believe her and short rates gaped up).
Bottom line, macro volatility is likely to remain elevated near term. We don’t think it will get worse, but it tough to see a path toward lower rate volatility over the next few weeks.

The real question is inflation going forward as that is what will determine how much volatility to expect in rates, equities, etc., longer term. On the one hand, base effects will keep the 12 month rate of core inflation high well into next year, but core CPI is likely to fall quickly after that (roughly next November). Gerard points out the Fed is unlikely to tightening policy knowing that info. On the other hand, underlying inflation pressures are note easing in the labor, goods or services markets. And it is tough to make the call that they will near term given strong economic growth.
Economic Supports: Household sector wealth accumulation in the current cycle is unprecedented in modern era, Core PCE growth ex Auto is likely to remain very strong and as / if Auto comes back, it will add significantly to GDP next year, the withdrawal of fiscal stimulus and its impact on consumption is behind us, the labor income component of personal income has been rising at an annualized rate of about 10% and there is little reason to expect a slowdown in personal income unless inflation moves MUCH higher and lastly, although it is not needed to support the economy, you do have the potential for consumer re-leveraging.
Bottom line: Given the economic strength, we need labor supply to come back and supply chains to clear up, if that happens, yield curves will steepen as the Fed becomes less of an issue for markets. Although company commentary on the supply chain front has been weak, there are improvements at the margin and commodity prices declined. If that continues, which is what we expect longer term, markets can grind higher, with volatility along the way, and Value will become more interesting. Short term, we will be more tactical given high inflation uncertainty (which leads to Fed uncertainty). We like long smaller caps on mean reversion near term.
We cover supply chains being more of a micro vs macro issue, why housing stocks and the housing backdrop is interesting.
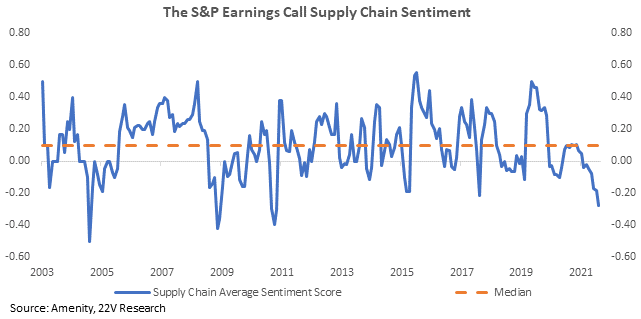
Supply Chains: Based on the Amenity natural language processing tool (NLP), company commentary toward supply chains has been very poor this earnings season. Negative supply chain commentary is likely impacting investors sentiment on the outlook for inflation and margins. It also suggests higher volatility or sensitivity to moves in short rates, inflation data or anything that suggests 1) supply chains might not be improving or 2) the growth outlook will slow (slowing growth with persistent supply chain issues is a bad combo).
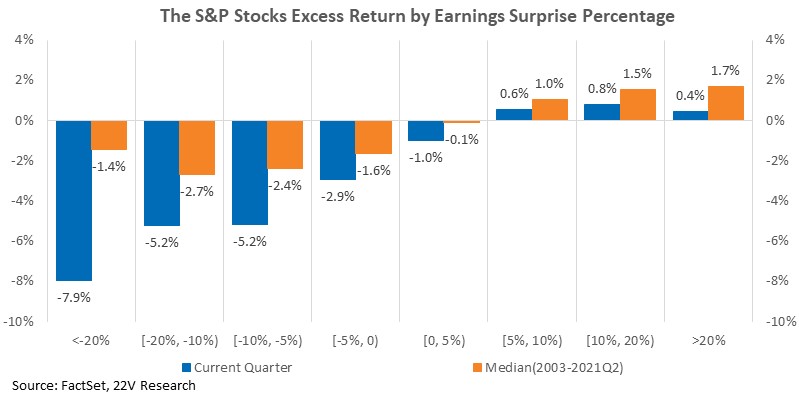
Relatively few companies have missed estimates, and avoiding those names has been more accretive to portfolio performance than normal. Supply chains and higher input costs are creating interesting alpha generation opportunities.
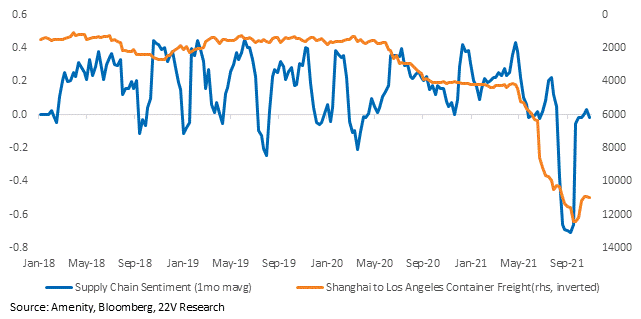
When Amenity runs the same NLP tool for news items related to companies and supply chains, we find supply chain sentiment has become less negative. To the extent that continues, freight rates are biased lower over time.
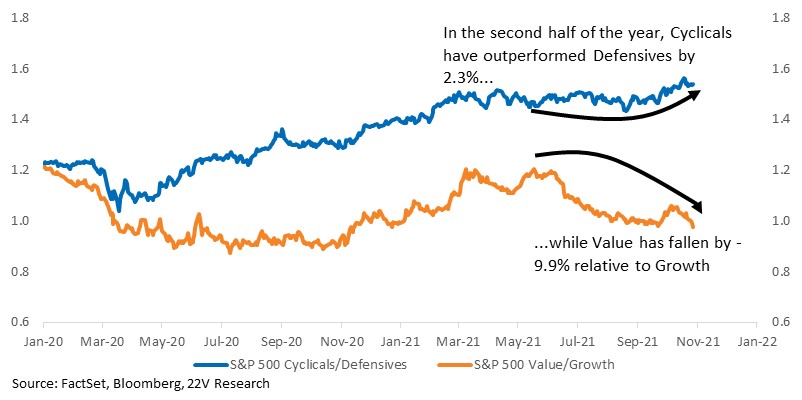
Cyclicals Are Not Value: Cyclicals have outperformed Defensives all year and are +2% over the last second half of 2021. Since the end of 2Q, Value has underperformed Growth by -10%. That is a significant spread.
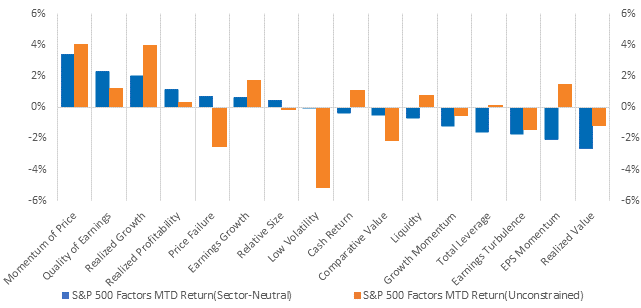
There have been divergences between factors on a sector neutral vs unconstrained (unconstrained means factors can have heavy sector skews) basis. Unconstrained performance was poor in October, but much better than sector neutral performance. Investors are buying Cyclicals, or stocks levered to stronger economic growth, but tilting toward growth names within those sectors. Strong economic growth with consistent supply chain concerns and macro uncertainty in general is leading to that type of positioning.
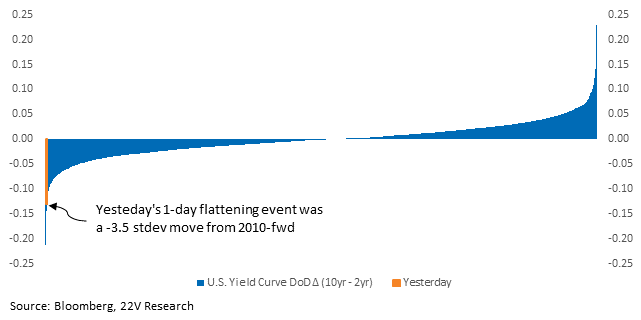
Yield Curve Flattening: Wednesday’s 1-day flattening event was a -3.5 stdev (2010-fwd), which raises concerns that there is some major problem on the horizon. To put the move into the context, the last three that were nearly this big were the day after the last election, a day of acute taper concern, and a day of delta fear.
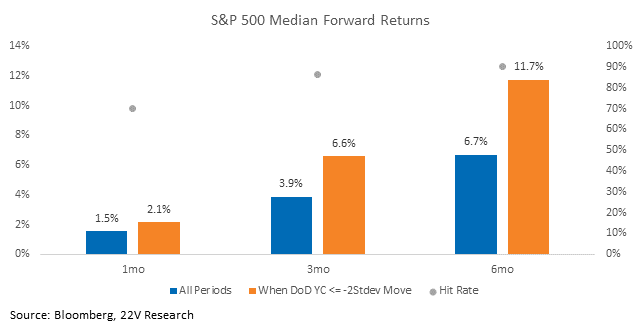
First and foremost, keep in mind that when the yield curve has a larger than two standard deviation move lower, forward market returns tend to be much strong than normal on a 1/3/6 month basis and with a high hit rate. Yield curve declines of this magnitude have occurred during corrections/bear markets and proved to be good buying opportunities. Today does not qualify as a correction or bear market, but that is telling; the curve flattened by an exceptional amount with a backdrop of strong equity returns, cyclical leadership and firm economic activity.
Implied real yields are deeply negative in the U.S., moving to a new record lows this week. That helps explain unprofitable tech performing well. Our measure of implied real yields is the 10yr – inflation expectations. So, not current inflation but the expected inflation rate. We are not just using unusually high YoY inflation prints to make our point. In theory, the US backdrop is becoming MORE, not less stimulative as a result.
With inflation expectations in Europe around 2.1%, the implied real yield in Europe is -2% and made a new low on Wednesday. In theory, that is more, not less stimulative.
Looking at the UK, which has been a major source of investor concern given the sharp increase in short rates and more hawkish commentary from the BOE, implied real yields have increased some recently, but still remain near one of their lowest levels on record.
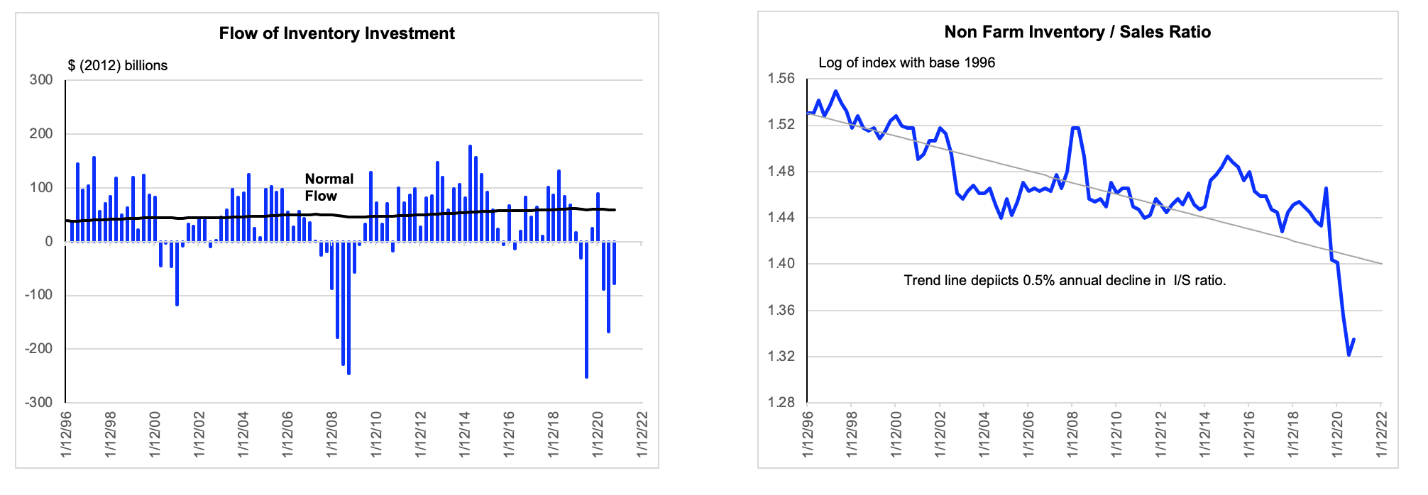
Economic Growth Tailwinds: From Gerard “Even without invoking the need to restore the level of inventories, there is some pent-up demand implied by the still-depressed flow of investment. A reasonable central case is that there might be about 60 bps of growth impetus each quarter on average for three quarters implied by the eventuality of the flow getting back to normal. If we were to imagine restoring the I/S ratio (the stock) to a more reasonable level, then the impetus might be close to a percentage point for three quarters.”
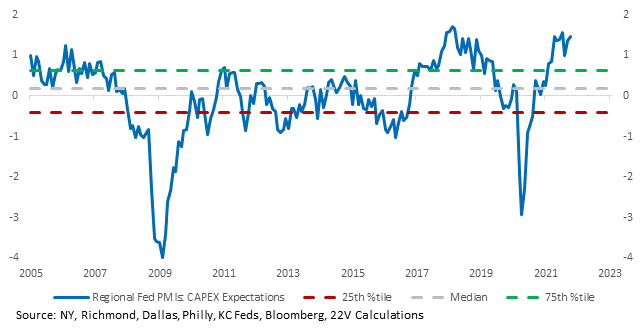
Side note…don’t expect Capex plans, which are very high historically, to move lower as real implied yield move into deeper negative territory. It just encourages more capex. When capex plans moved off the highs in 2018, real yields were +250bp from current levels.
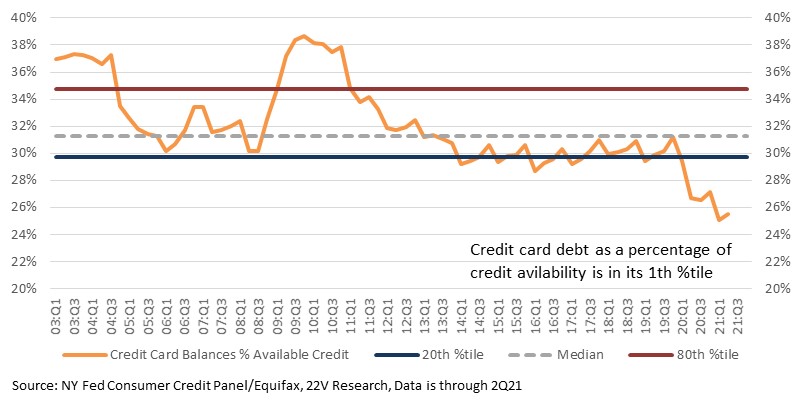
Housing / Consumer Supports: As Gerard noted in a recent report, four things continue to support a strong consumer: 1) Core PCE growth ex Auto is likely to remain very strong and as / if Auto comes back, it will add significantly to GDP 2) The withdrawal of fiscal stimulus and its impact on consumption is behind us 3) The labor income component of personal income has been rising at an annualized rate of about 10% during the withdrawal period mentioned and there is little reason to expect a slowdown in personal income unless inflation moves MUCH higher 4) There is a monster wealth effect supporting the household sector right now. This is concentrated in richer people, but it still has an impact. And although it is not needed to support the economy, you do have the potential for consumer re-leveraging.
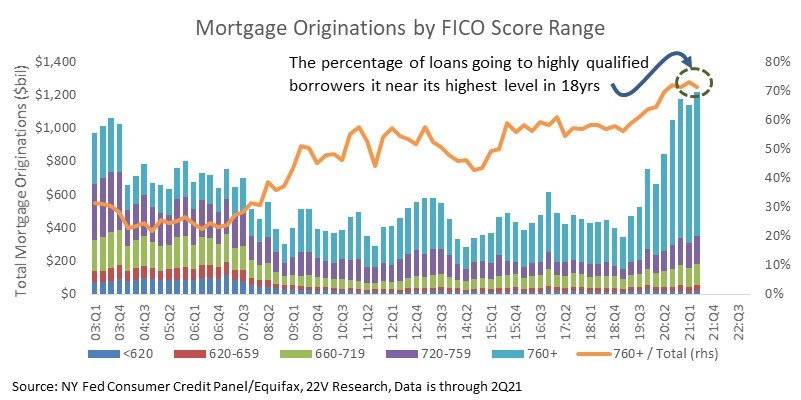
Housing has had a positive wealth effect, but we are in a much better position now vs the last housing wealth effect regime. Today’s backdrop shares very little in common with the housing crisis period. By total loan value, 25% of mortgage originations in 2006/07 were to subprime borrowers. Today, subprime borrowers make up closer to 4% of new mortgages. Over the past year, highly qualified buyers (FICOs>=760) have made up more than 70% of mortgages, near the highest reading in 18 years.
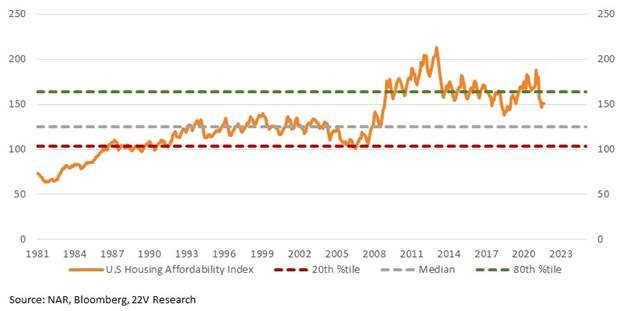
The housing affordability index was 151.3 through the end of September (latest reading). As a reminder, the Affordability Index measures how much of the median home the median household can afford given current mortgage rates. So currently, the median U.S. household can afford 1.5x the price of the median home. That is down sharply since the start of the year but still at the high end of its historical range.
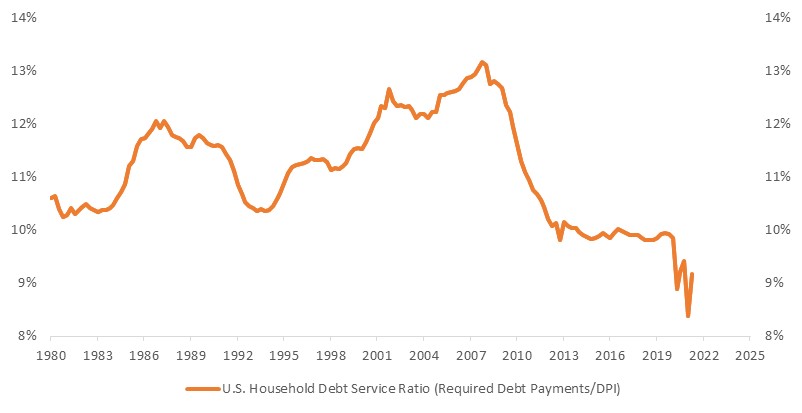
The Household debt service ratio has just increased from 40 year lows.
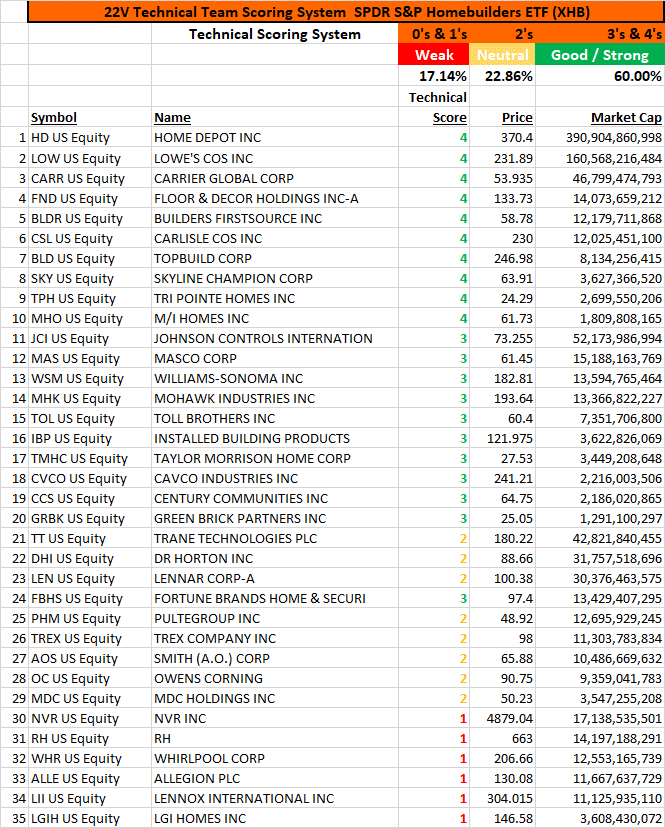
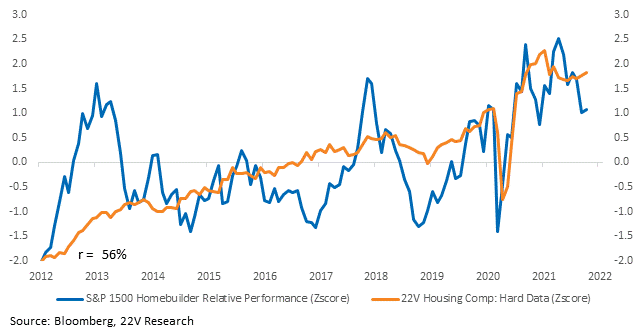
The breadth of hard housing data is strong and we’ve outlined the case for it to remain robust. That bodes well for Homebuilder stock performance, which is off -14% from its highs relative to the S&P 1500 in April. Investors have not embraced the case for sustainable housing strength. FYI, we do not have a good read on which companies will navigate supply chain constraints best.
John Roque, 22V Technical Analyst, scored the constituents of the XHB (SPDR S&P Homebuilders ETF). John’s scoring system uses a scoring range of 0 – 4:
0’s & 1’s = poor, weak, bearish
2’s = neutral
3’s & 4’s = good, strong, bullish