
Our entire repository of COVID charts is HERE.
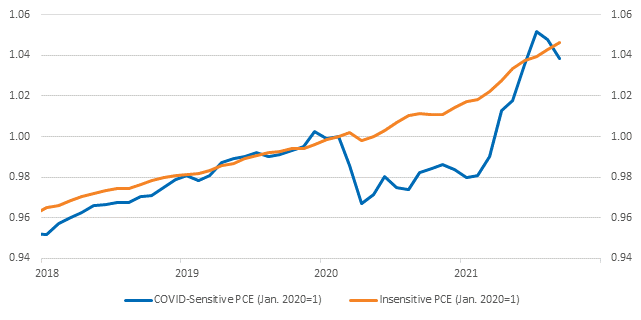
According to today’s PCE report, COVID-sensitive spending fell in September relative to insensitive spending. Gerard MacDonell, 22V’s economist, believes this is probably a lagging indicator of the Delta Wave affecting perceived value and demand. At the margin it would suggest that core PCE is recently slightly understated. The effect of that drag will wear off or perhaps even reverse. The weakness is not a big deal.
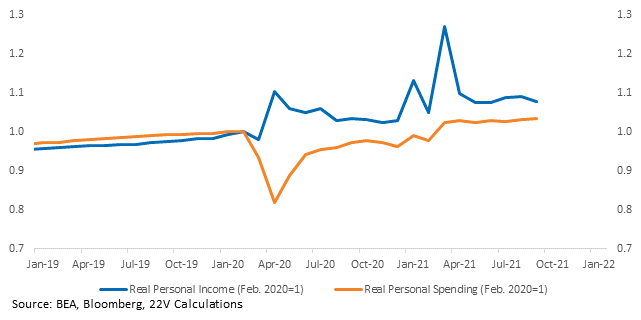
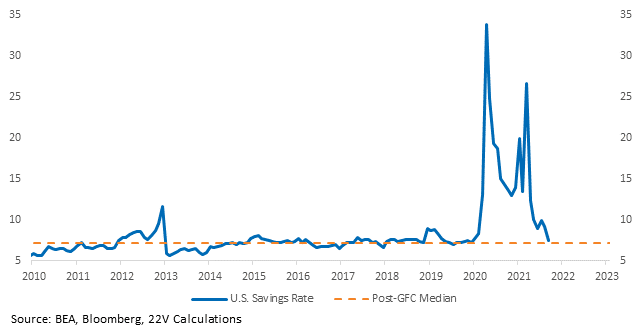
Also per Gerard, “The underlying saving rate net of all the fiscal supports to the household sector is still very healthy. Labor income growth is ripping, even in real terms, and wealth effects are very supportive. Somewhat predictably, at least with those inputs given, underlying consumer spending growth is decent. I would be inclined to extrapolate that.” The flow of savings is still positive. Also keep in mind that since the Biden fiscal stimulus peaked in March, the real PCE ex-autos has grown at a rate of 5.2% (annualized). The consumer soft spot can arguably (I pick yes) be attributed largely to supply-chain disruptions in the auto sector. Do not interpret weakness in the headline figures as evidence that demand is not responding to stimulus.
The Chicago Fed’s first CARTS estimate is out. Weekly retail trade increased +1.2% the first week of October and +0.5% the second week. The CARTS estimate for retail sales is +2.3% MoM. Consensus has it at +0.8%, though retail sales are released on 11/16 so analysts will probably be tightening up estimates. This series indicates continued consumer strength.

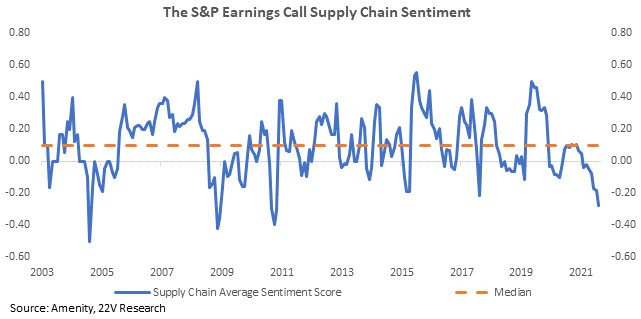
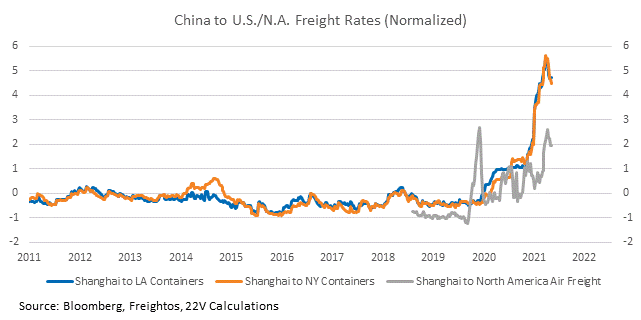
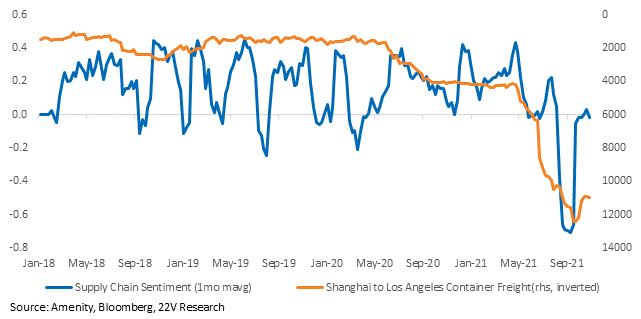
Consumer demand is not the problem; supply chain constraints are the problem. Amazon and Apple were both held back by supply chain issues and in AMZN’s case specifically, labor costs. The AAPL/AMZN news fits with the broad earnings season trend of consistently negative supply chain sentiment. Based on the Amenity natural language processing tool (NLP), company commentary this earnings season was particularly poor. The negative supply chain commentary is likely impacting investors sentiment on the outlook for inflation and margins. It also suggests higher volatility or sensitivity to moves in short rates, inflation data points or anything that suggests 1) supply chains might not be improving or 2) the growth outlook will slow (slowing growth with persistent supply chain issues is a bad combo). When Amenity runs the same NLP tool for news items related to companies and supply chains, on the other hand, we find that supply chain sentiment has become much less negative. To the extent that continues, freight rates are biased lower over time. Freight rates were stable this week at a high level but below the peaks.
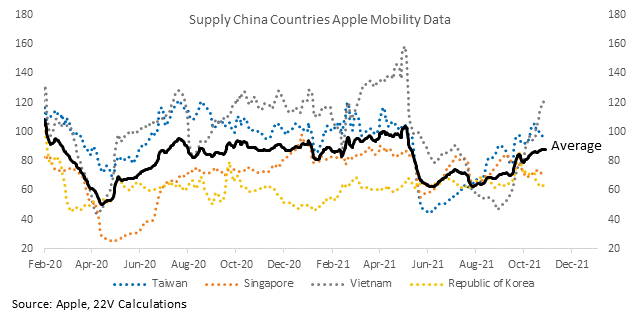
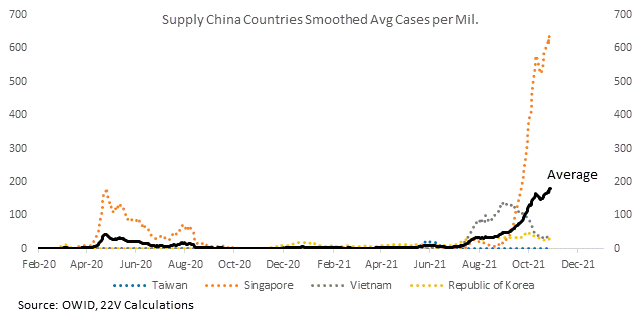
COVID trends are better in supply chain countries. And that’s how improvement in supply chain constraints starts. Case growth in Singapore is higher but severe cases remain low.
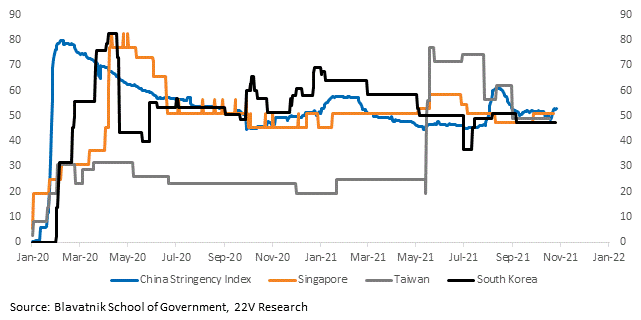
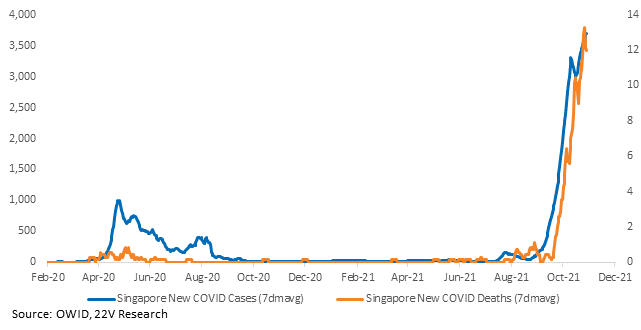
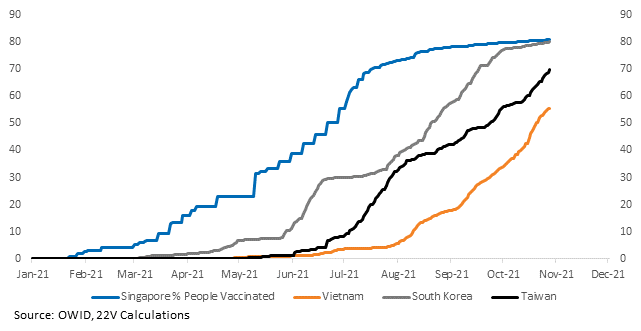
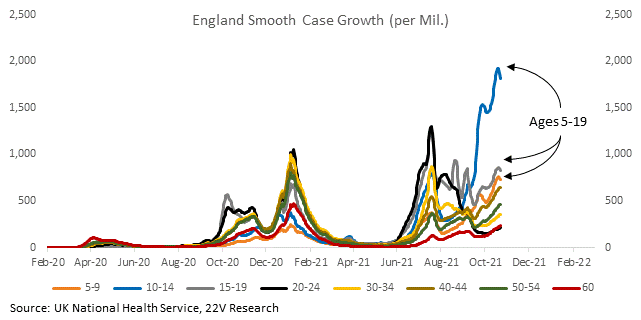
FYI, the FDA has authorized use of the Pfizer COVID vaccine for kids 5-11. That’s particularly useful as we’ve seen case growth spike in the UK in younger cohorts.
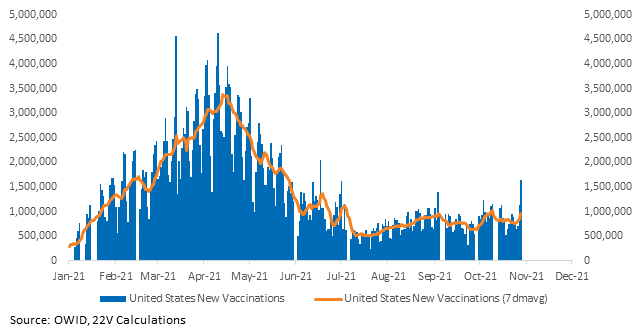
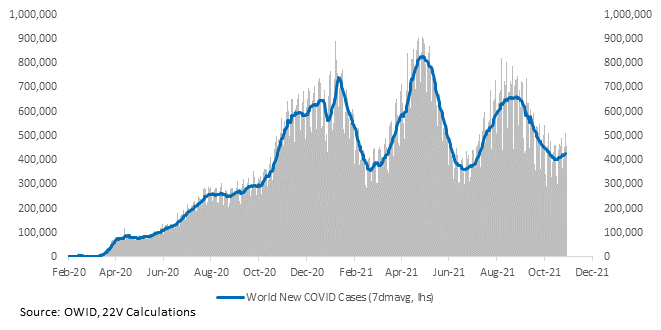
Global case growth is increasing. Case growth is concentrated in Eastern Europe in Russia, which have poor vaccination rates.
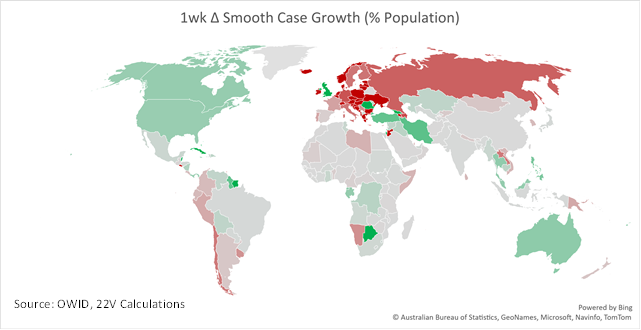
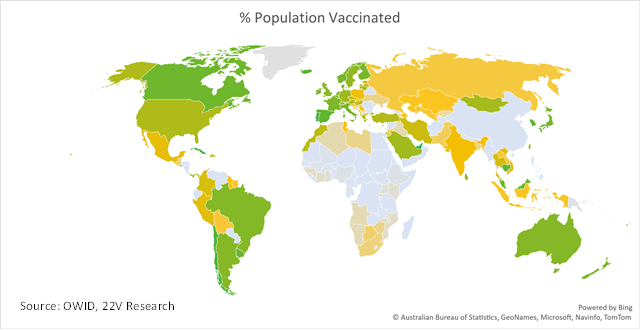
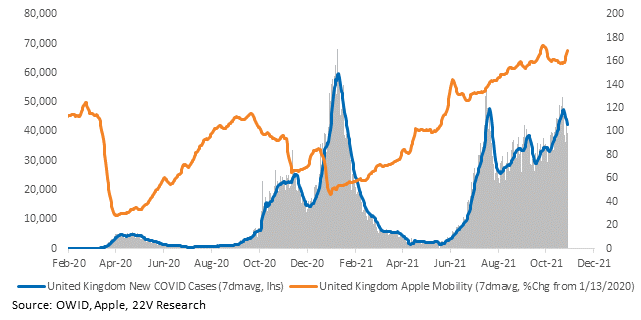
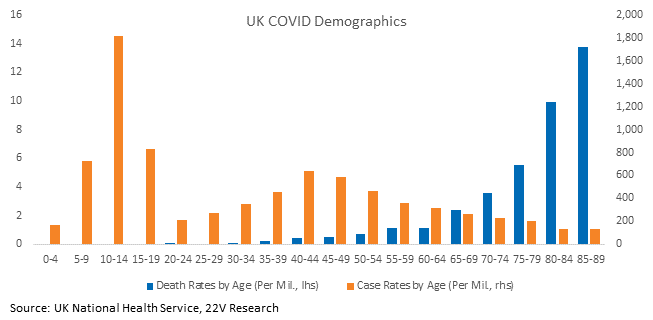
Case growth is improving in the UK. That’s especially comforting since the UK is a high vax country. Case growth has remained in younger cohorts, who are not vaccinated and for whom COVID is not as dangerous. Headline activity, represented through mobility, was only marginally affected.
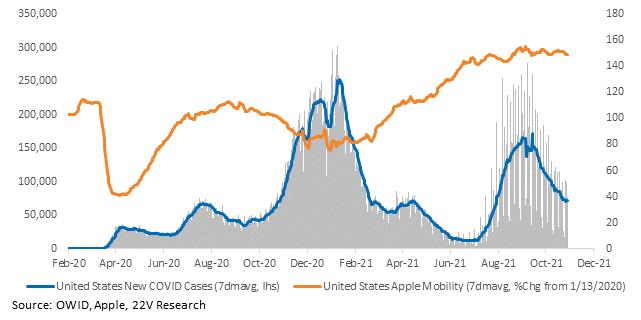
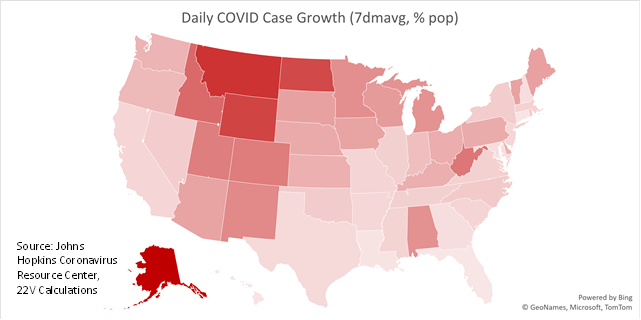
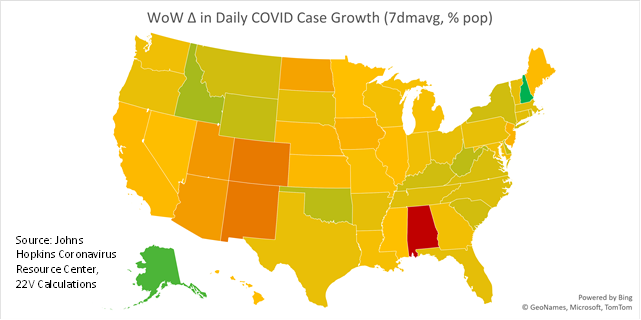
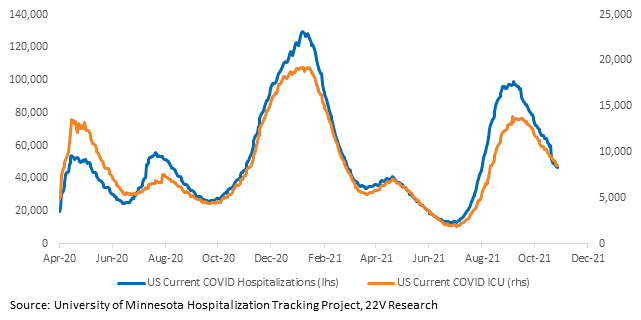
COVID trends in the US are good. No new developments here.
Charts for every country and state we have data for are HERE.

