
If you’re of a certain age, you’ll likely remember the old Batman television series which starred Adam West in the titular role. Our favorite villain was the Riddler who was played by Frank Gorshin. His calling card was to ask – of course – riddles of Batman and the boy wonder, Robin. Not only were his riddles brain teasers, but he had the coolest suit around.

If the Riddler were going to ask Batman and Robin to solve a market puzzle we think it might go something like this:
“Riddle me this, market analysis duo – How can NASDAQ and the S&P be at all-time highs with only 41% and 56% of the stocks on the NYSE and NASDAQ be above their 200-day moving averages?”
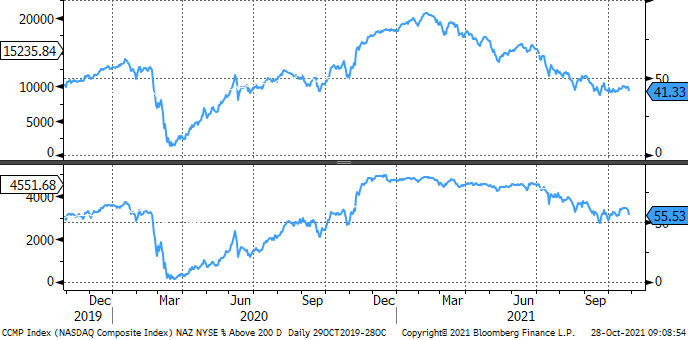
It’s a riddle we attempt to answer daily but we believe it’s because the indexes are less egalitarian than they’ve ever been and because the top 7 market cap stocks in NASDAQ account for 38% of the weight in the index and the same 7 stocks make up 25% of the S&P. it’s for this reason that we believe the market’s “story” is better told by looking beneath the surface. For example, we’re finding a good number of stocks with deteriorating to poor technical set ups (i.e. shorts). Please see below for a look at some stocks that score poorly in our Technical Scoring System.
A more important riddle yet unsolved is, “When will the internal deterioration have a negative impact on the major indexes?” When we figure it out we promise you’ll be the second ones to know.
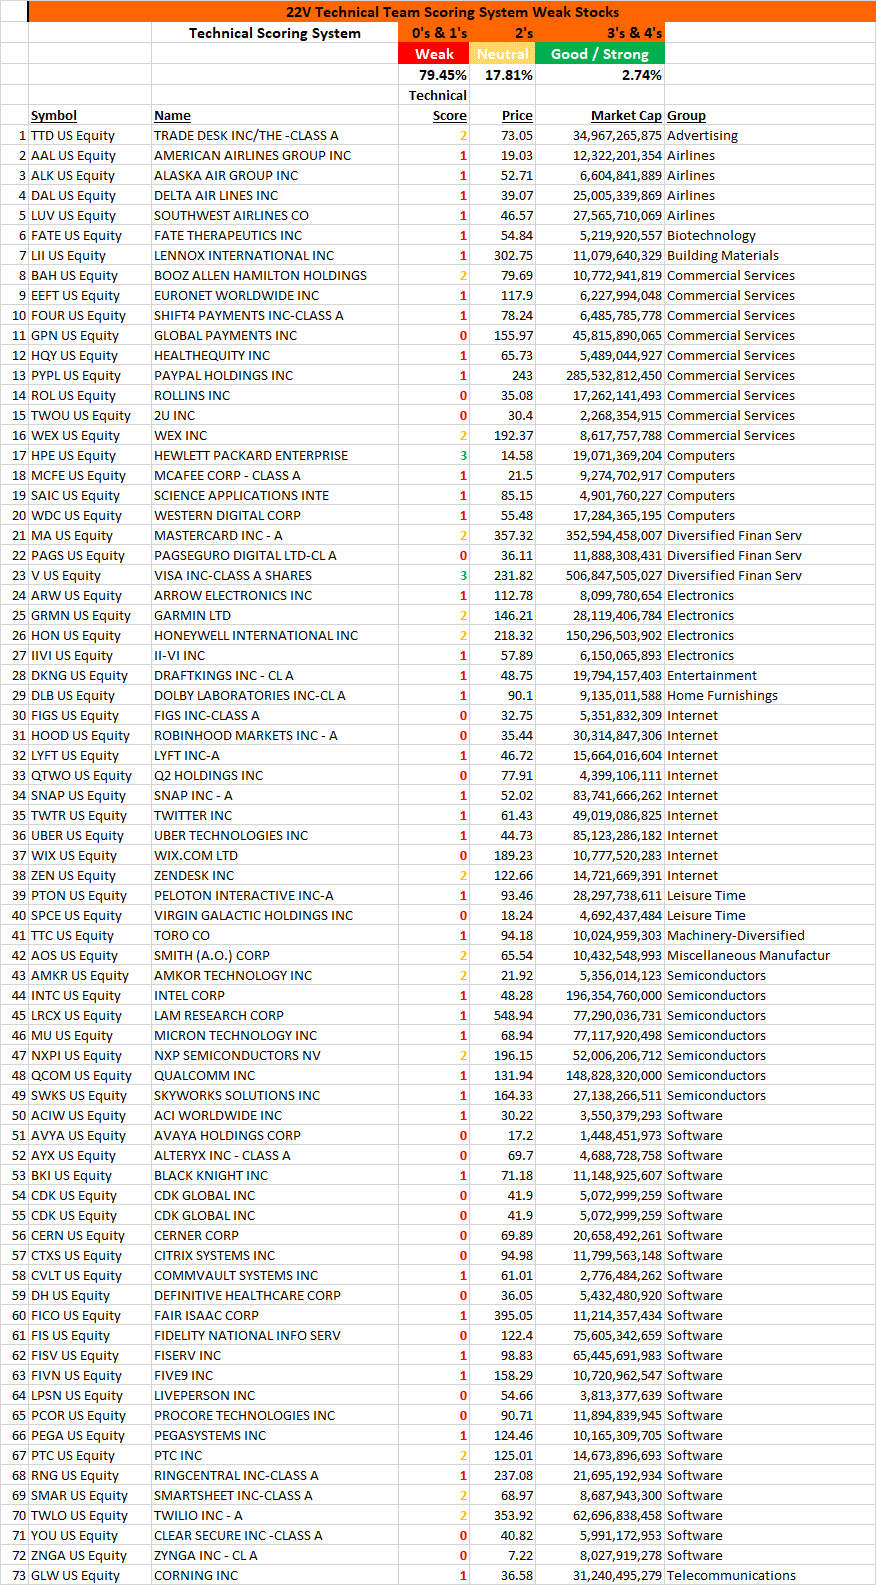
Source: 22v Technical Research

