
SUMMARY: Given the move in short rates and yield curves, the main worry of investors we talk to is either inflation is going to shoot higher and kill growth or that same inflation will force central banks to crush activity. EVERYONE RELAX. Those are 1) not the only options and 2) should not be the base case. Yesterday’s 1-day flattening event was a 3.5 stdev (2010-fwd), which raises concerns over some major problem on the horizon. Keep in mind that yield curve declines of this magnitude have occurred during down markets and proved to be good buying opportunities. Today does not qualify as a correction or bear market, but that is telling; the curve flattened by an exceptional amount with a backdrop of strong equity returns, cyclical leadership and firm economic activity.
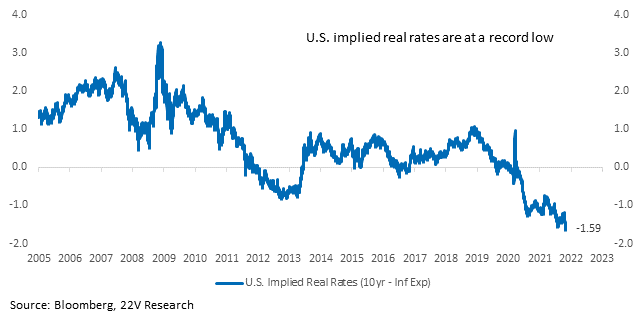
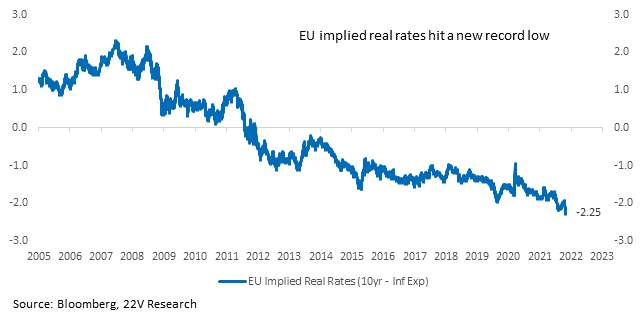
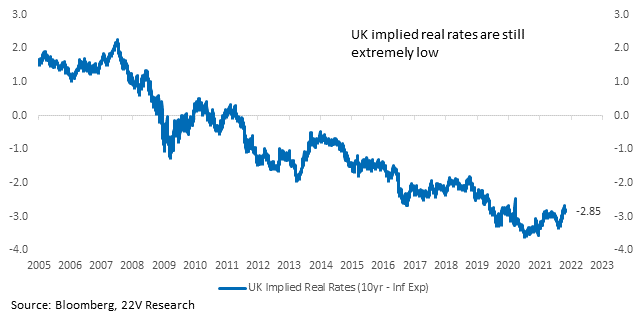
The forward returns are meaningless if we are headed into a major economic slowdown. But as a client noted at a macro dinner we hosted last night, 10yr real implied yields are deeply negative and have become MORE negative over the past few weeks as long rates decreased and inflation expectations remained stable. Real implied yields in parts of Europe are at new lows. U.S. real implied yields (10yr yields – inflation expectations) are -160bp, in -225bp in Europe and -285bp in the UK. Yes, the Bank of England has sounded more hawkish and short rates have increased, but does that translate into central banks “crushing growth” if real implied yields are either 1) falling to record lows or 2) remain at historically low levels? The answer is no and that helps explain why credit spreads have remained tight.
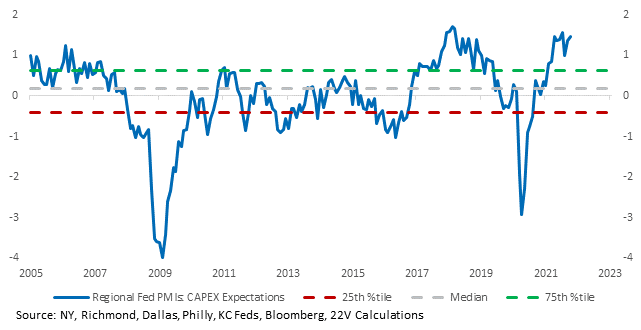
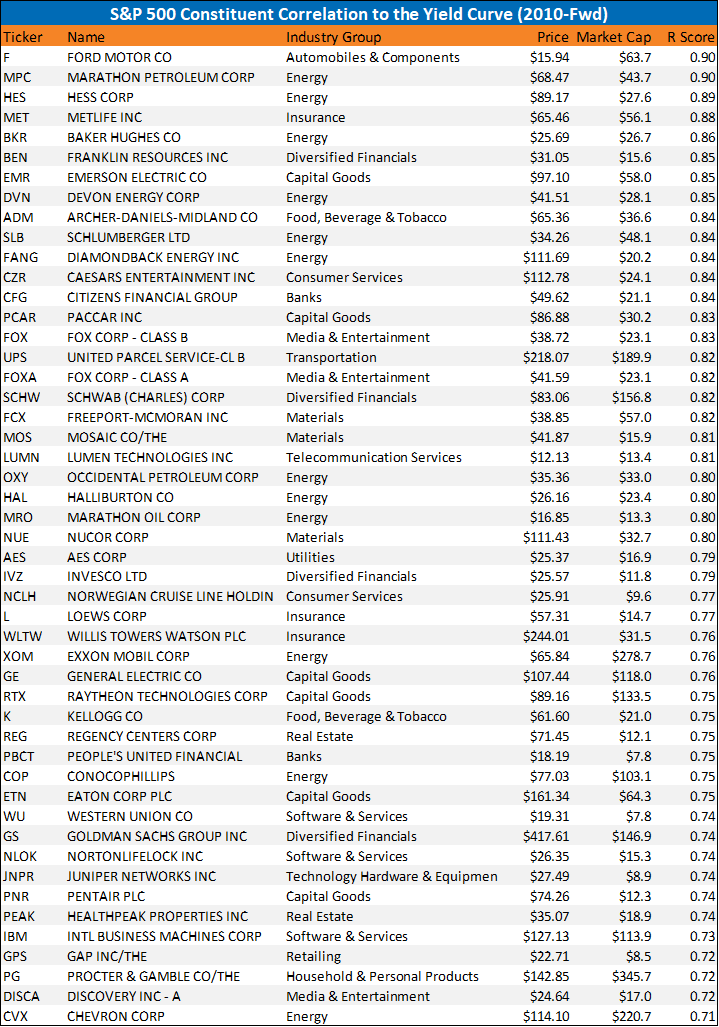
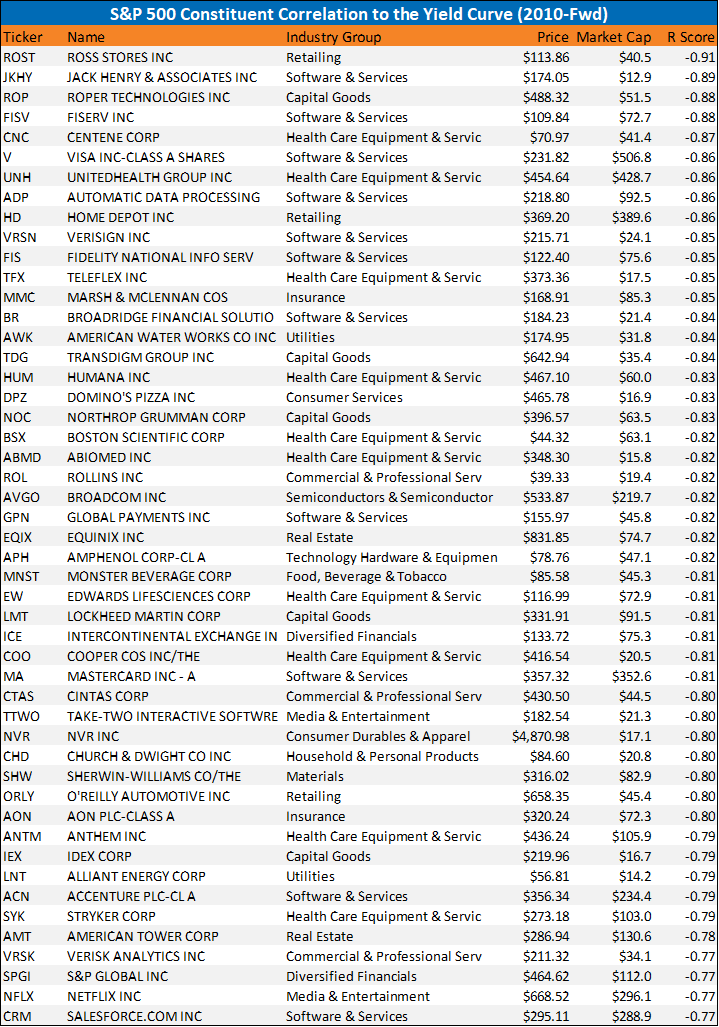
U.S. Capex plans are at historically high levels and the flow of savings is positive, so a decline in real implied yields could be viewed as stimulative. That is good for housing (we like Homebuilders) and eventually small caps. Take a look at small caps given the backdrop and how much they have underperformed recently. We highlight the groups of stocks that are most positively and negatively correlated to changes in the yield curve. Longer term investors should be looking at the yield curve steepening basket.
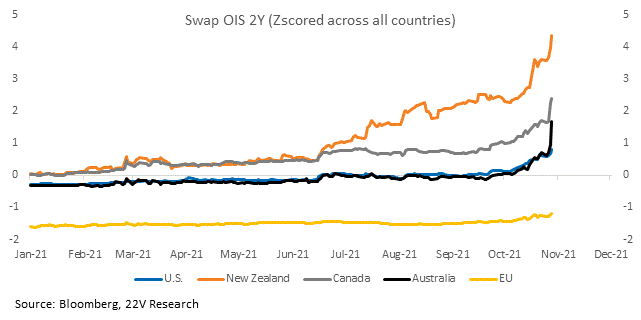
Keep in mind that the forward rate hike curves have moved up significantly in Australia, New Zealand and Canada, but the US is lagging significantly (chart below). This has implications for the USD (weakness) and suggest the Fed isn’t pushing the cost of capital higher across the world. Rates are increasing globally because growth is firm, economies are reopening and inflation is biased higher. Higher yielding emerging markets could become more interesting going forward. Also, look at Europe’s rate curve, hasn’t budged. The worlds two most important central banks are lagging EVERYONE.
Full report below…
MARKET VIEWS: Short rates have moved higher across the world leading to sharp flattening of yield curves and news stories implying a sharp slowdown in economic growth is coming. The main theme is as follows, either inflation is going to shoot higher and kill growth or central banks are going to crush growth. EVERYONE RELAX. Those are 1) not the only options and 2) Should not be the base case. We understand that yesterday’s 1-day flattening event was a -3.5 stdev from 2010-fwd, which raises concerns over some major problem on the horizon. To put the move into the context, the last three that were close to this big were the day after the election, a day of acute taper concern, and a day of delta fear.
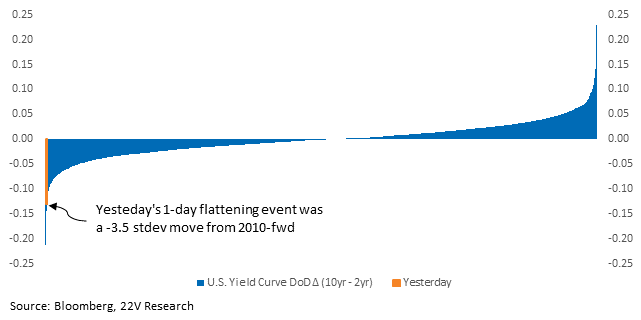
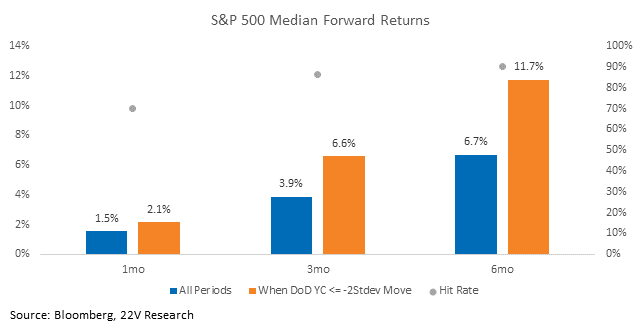
First and foremost, keep in mind that when the yield curve has a larger than two standard deviation move lower, forward market returns tend to be much strong than normal on a 1/3/6 month basis and with a high hit rate (we have 75 data points going back to 2010). Keep in mind that yield curve declines of this magnitude have occurred during down markets and proved to be good buying opportunities. Today does not qualify as a correction or bear market, but that is telling; the curve flattened by an exceptional amount with a backdrop of strong equity returns, cyclical leadership and firm economic activity
As an investor pointed out at a macro dinner last night, real yields are deeply negative and only have become MORE negative as long rates decreased and inflation expectations remained stable at high levels. Real implied yields (10yr yields – inflation expectations. So not current inflation, but the expected inflation rate. i.e., we are not just using unusually high YoY inflation prints to make that point) are deeply negative in the US and moved to new record lows this past week (helps explain unprofitable Tech doing well). In theory, the US backdrop is becoming MORE, not less stimulative as a result.
In Europe real implied yields are even more negative. Short rates have moved up in Germany (they have moved from -.76bp to -.64bp) and German 10yr yields are still -15bp. With inflation expectations in Europe around 2.10%, the real implied yield in Europe is -2.25% and has made a new low. In theory, that is more, not less stimulative.
Looking at the UK, which has been a major source of investor concern given the sharp increase in short rates and more hawkish commentary from the BOE, real implied yields have increased some recently, but still remain near one of their lowest levels on record. Bottom line, nothing in the bond market suggests a problem for growth is imminent and, in the US and Europe, the backdrop appears to be more stimulative.
Also keep in mind that the forward rate hike curves have moved up significantly in Australia, New Zealand and Canada, but the US is lagging significantly (chart below). This has implications for the USD (suggest weakness) and given the Fed is the most important central bank for setting the cost of capital, helps ease financial conditions globally. Put differently, the Fed isn’t dragging the cost of capital higher across the world, it is happening because growth is firm, economies are reopening and inflation is biased higher globally. Higher yielding EM countries could become much more interesting going forward. Also, look at Europe’s rate curve, hasn’t budged. The worlds two most important central banks are lagging EVERYONE.

Side note…don’t expect Capex plans, which are very high historically, to move lower as real implied yield move into deeper negative territory. It just encourages more capex. When capex plans moved off the highs in 2018, real yields were +250bp from current levels.
We highlight the stocks with the most positive and negative correlation to Yield Curve from 2010-fwd below. If you believe, like we do, that economic growth will remain firm, the Fed pro growth and supply chains issues will ease some, we would be focusing on stocks that benefit from steeper yield curves. On a longer term basis. Macro uncertainty and volatility are likely to be to high to take advantage of that today. Maybe that will change if a fiscal package gets done though.
First one is positive correlation to yield curve…
Source: Bloomberg, FactSet, 22V Research
Negative correlation to yield curve.
Source: Bloomberg, FactSet, 22V Research

