China’s CSI 300 Index – Technicals Weak Across the Board
Using our Technical Scoring System, which uses a 0 – 4 range, has the CSI 300 Index with a punk Score = 1. Good scores = 3’s and 4’s, Neutral scores = 2’s and Weak scores = 0’s and 1’s.
Certainly our Technical Score will reflect what follows below, but we’re going to list the technical inputs that concern us just the same.
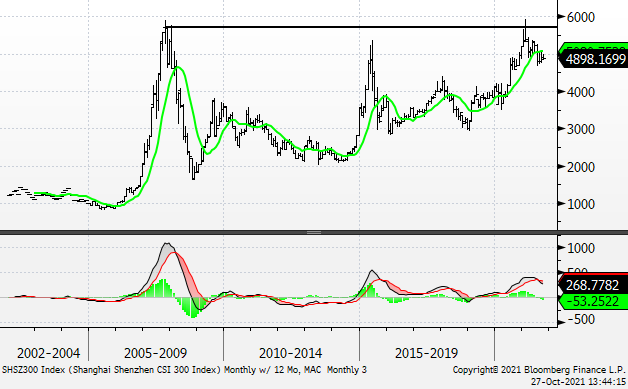
For example, the CSI 300 Index is beneath its 50-day moving average, its downward-sloping 100-day moving average, and its cresting 200-day moving average and has been beneath these moving averages for three months in a row. Strong items, of which the CSI 300 Index is not, don’t spend much time beneath downward sloping moving averages.
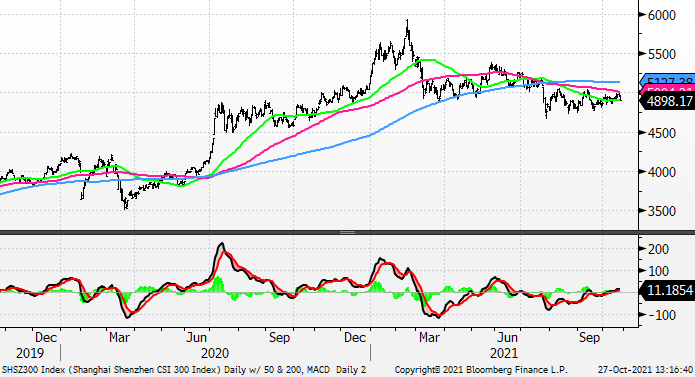 The relationship between the CSI 300 and its cresting 40-week moving average is clear here and, as we noted above, the CSI 300 is soft when it spends time below its downward-sloping moving averages. Also, the weekly MACD in the middle panel is in negative territory and can be considered oversold, but the combination of the index below its cresting 40-week moving average and unimpressive momentum tell us that we should be expecting the index to work lower next. The lowest panel in this chart grouping shows the CSI 300 relative to the S&P 500 and there’s no doubt that this action is bearish.
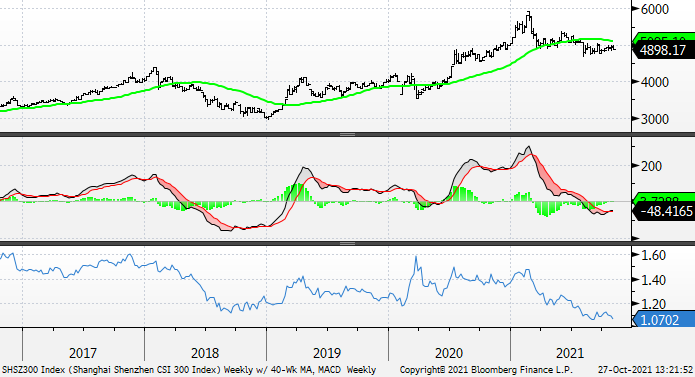
The monthly chart below might be the most damning of all as the CSI 300, which peaked in February, was turned away from historical resistance (see late 2007 – early 2008) with great prejudice, is below its 12-month moving average, and monthly momentum (via the MACD in the lower panel) has crested and rolled.
Going back to the early 2000s we count five bear markets for the index: 1) -41% for 16 months from Mar ’04 – July ‘05
2) -73% for 12 months from Oct ’07 – Oct ‘08
3) -47% for 46 months from Aug ’09 – June ‘13
4) -48% for 8 months from June ’15 – Feb ‘16
5) -33% for 11 months from Jan ’18 – Dec ‘18
The above data works out to an average bear market of -48% that lasts about 19 months. Median figures show a bear market of -47% over 12 months.
We believe the CSI 300 has risk to the 4000 level which represents further downside to the tune of -18%. Conveniently, that 4000 level would also be in line with the prior smallest bear market we’ve seen for the index.