
Our entire repository of COVID charts is HERE.
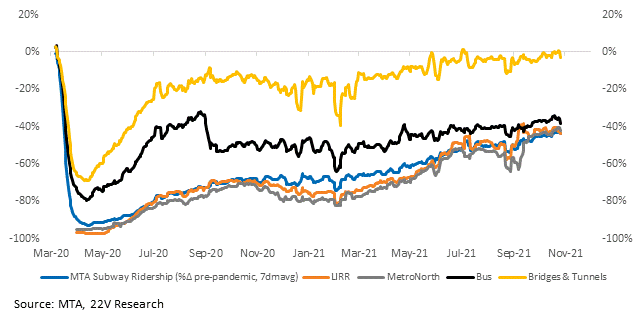
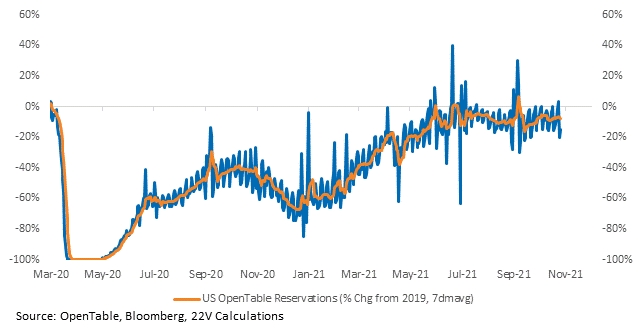
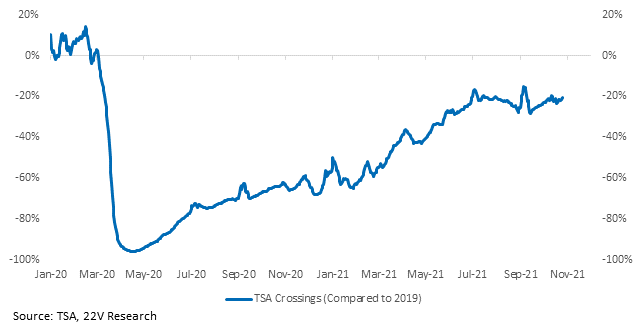
Kastle’s check-in data shows gradual increases again this week. Houston is the highest at 51% of pre-COVID levels. NYC is at 32%. NYC’s MTA ridership is gradually increasing across the board as well. Subway and rail traffic is now down -40% compared to pre-COVID. OpenTable reservations are fluctuating around -10% and TSA crossings at around -20% compared to 2019. There’s still room to go before ‘normalcy’ is achieved.

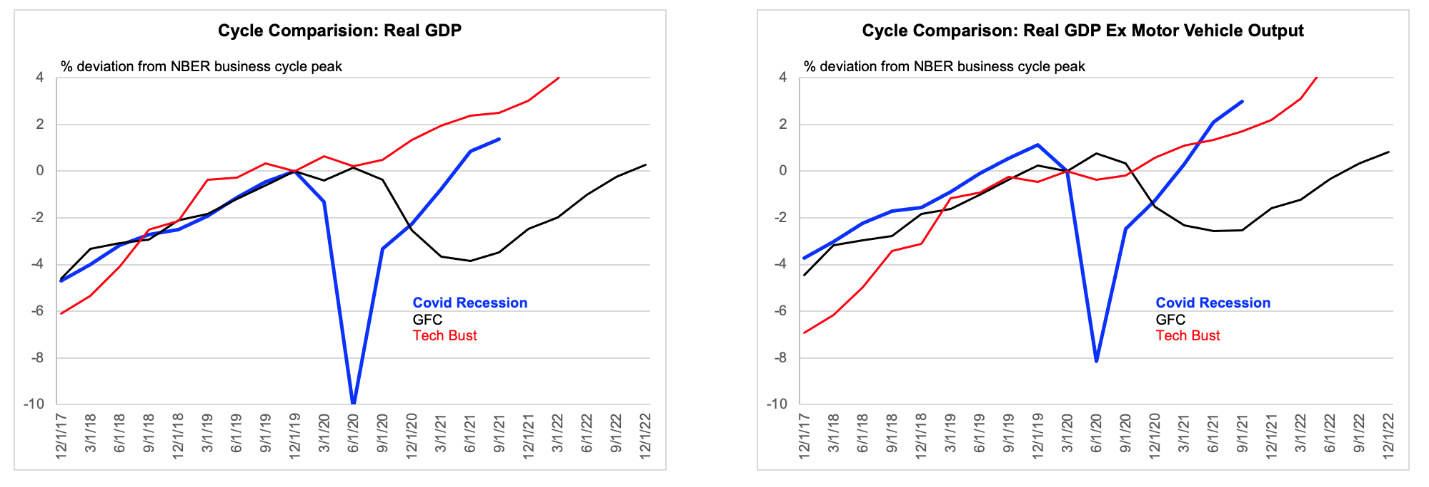
Broadly speaking though, economic activity remains strong. According to Gerard MacDonell, 22V’s economist, today’s GDP report is old news BUT it indicates underlying demand conditions remain buoyant. GDP growth and PCE growth are above prior cycle comps when we account for the auto sector, which is depressed because of supply constraints, not because of demand. That indicates some pent-up demand, which will be a tailwind soon.
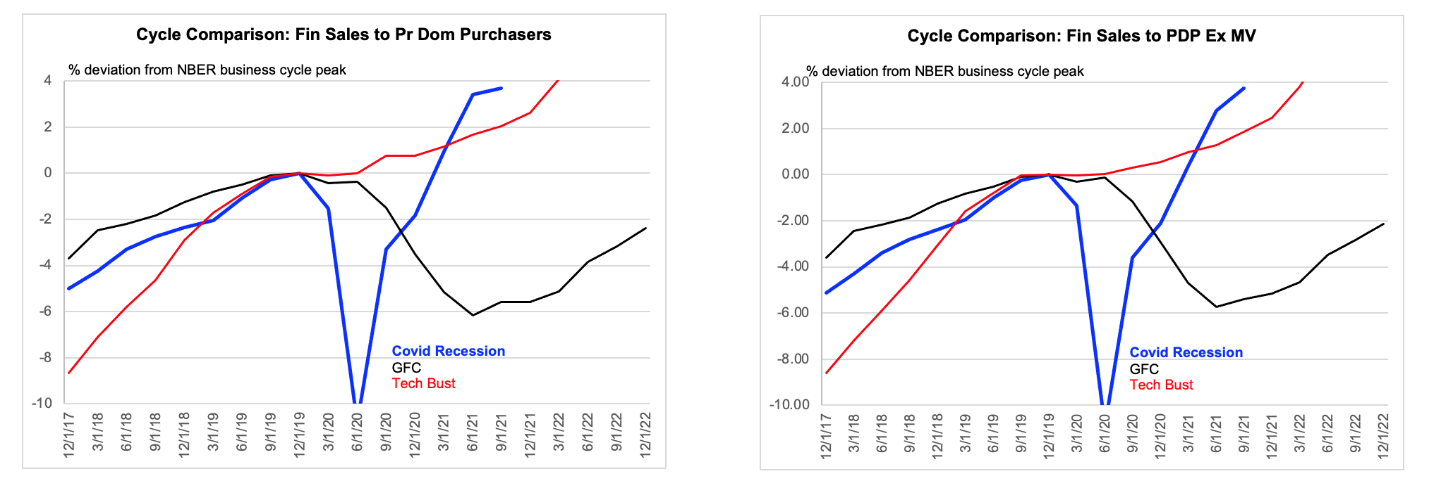
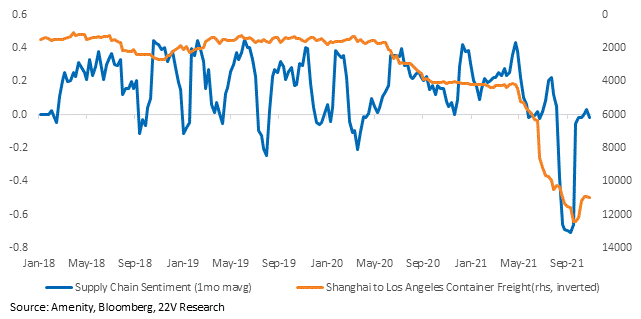
Speaking of supply constraints: supply chain sentiment dropped a little last week. Freight rates increased a bit, but are still $2,000 below the peak. COVID trends in supply chain countries are better, which should help alleviate shipping costs over time.
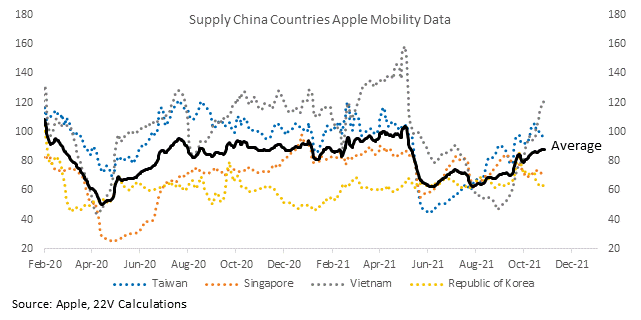
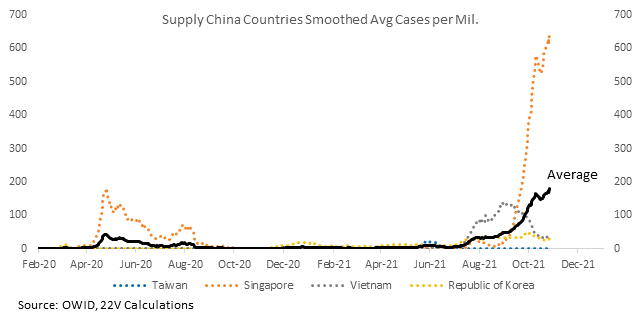
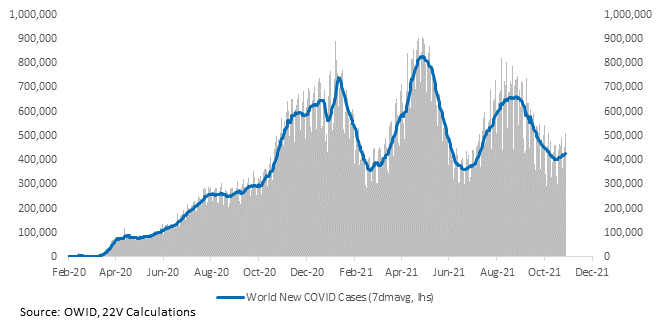
Global case growth increased again yesterday. Growth is still concentrated in Eastern Europe and Russia, which have poor vaccination rates.
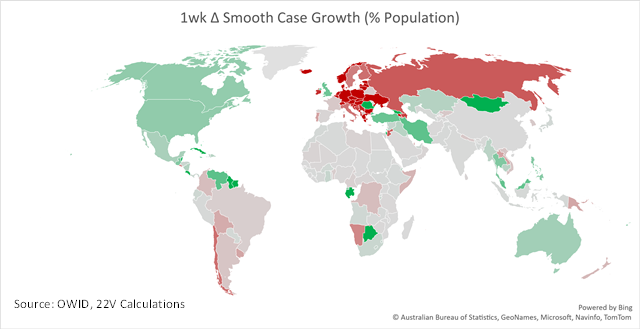
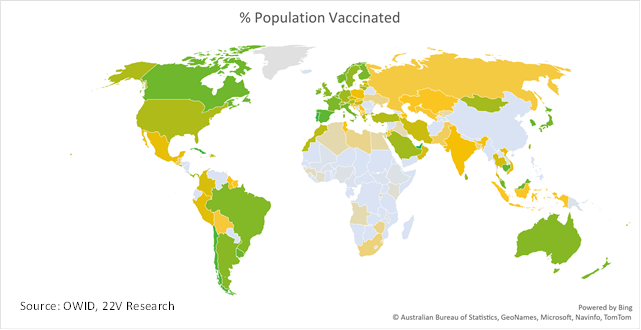
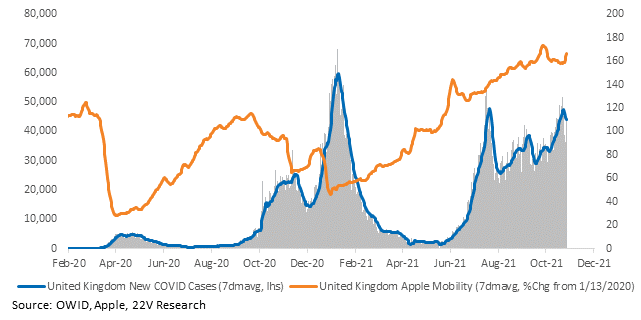
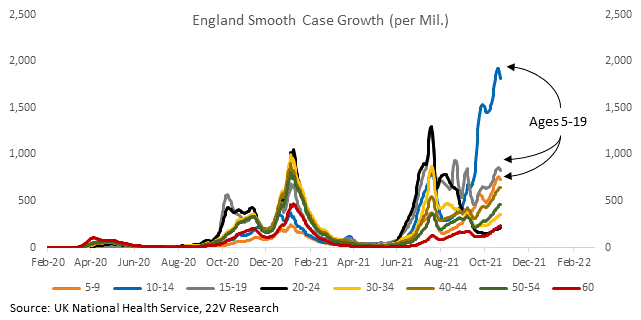
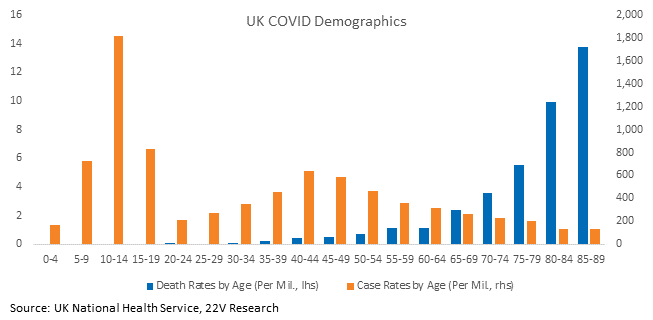
Case growth is improving in the UK. That’s especially comforting since the UK is a high vax country. Case growth has remained in younger cohorts, who are not vaccinated and for whom COVID is not as dangerous. Headline activity, represented through mobility, was only marginally affected.
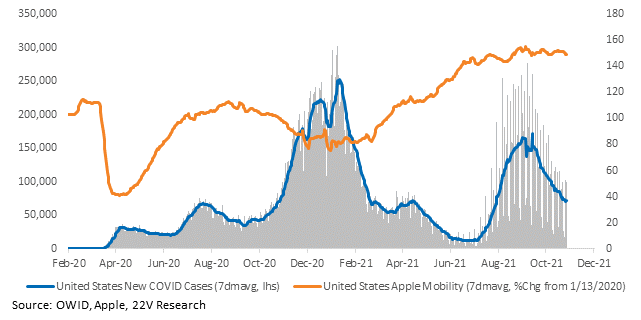
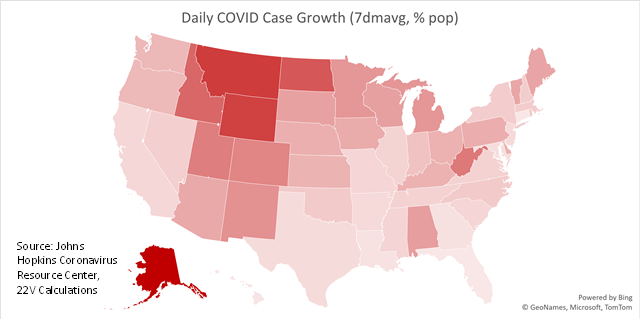
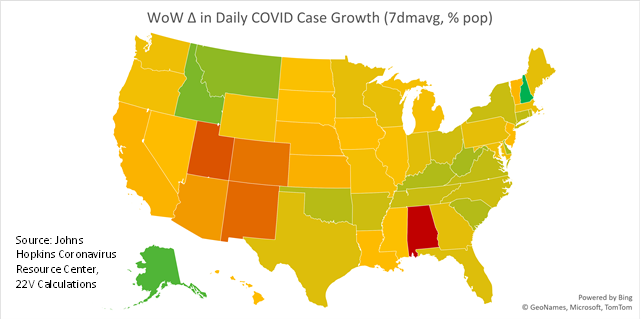
Case growth in the US continues to decline. No new developments here.
Charts for every country and state we have data for are HERE.

