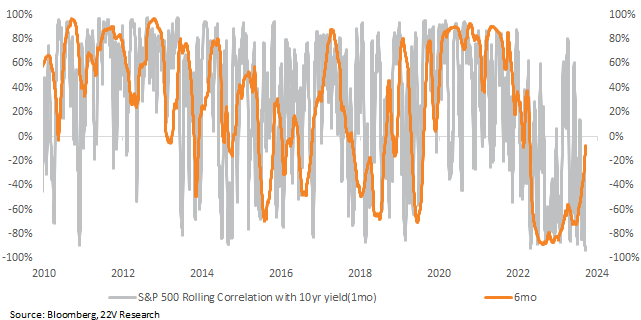
Strong economic growth readings have been a major contributor to the backup in the US 10yr yield over the past few months, short rates are at their highest level since the TMT bubble, and futures are pointing to increased odds of additional hikes. Concerns that too hot growth will result in more Fed tightening have weighed on stocks in August, driving the short-term correlation between 10yr yields and stocks to an extreme (99th %tile) negative level. A weak CPI print this morning and a cooling off of hot data could reverse the recent trends in rates. Either way, despite Treasury vol being well off its high, it is likely to remain elevated until there is a clearer path for growth, inflation, and Fed policy.
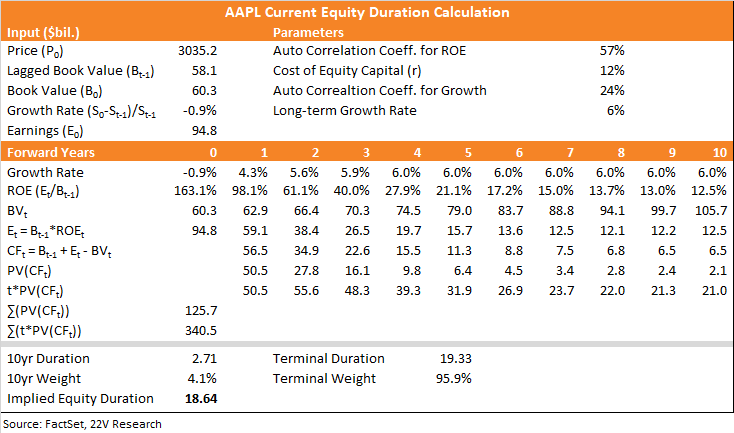
To help quantify the rate risk of individual stocks, today we are introducing an implied equity duration factor, following the process laid out by Dechow, Sloan, and Soliman (HERE). This isn’t meant to be a forecast of actual duration. As the authors noted “Because the terminal cash flow perpetuity is inferred from the observed stock, we refer to the resulting measure of equity duration as implied’ equity duration. In other words, our measure of equity duration is based on investors’ consensus expectations, as reflected in stock prices, rather than on necessarily rational forecasts of future cash flows.” A worked example using AAPL is in the full report.
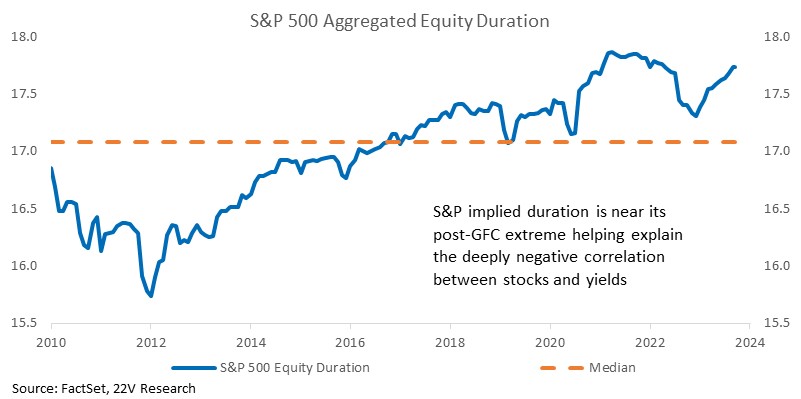
Applying that calculation across equities and aggregating the fundamentals to the index level shows that S&P implied duration has climbed steadily since 2012 and peaked in mid-2021. The bottom line is that implied duration suggests the S&P is more sensitive to changes in yields than in the past. That is consistent with the extremely negative correlation between yields and stocks today.

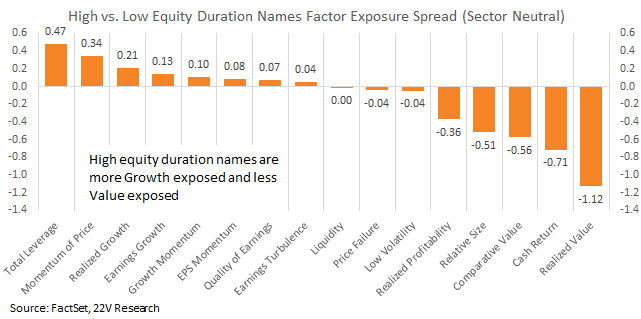
Helpful for the current backdrop, Implied Equity duration is uncorrelated with other risk exposures. High vs. low implied duration names have roughly equal exposure to risk-on/off factors. Duration is similar to the style trade in construction and behavior, so high implied duration tends to be Growth, and low implied duration tends to be Value. This also helps explain why Growth has struggled as yields have surged higher while Value has fared better.
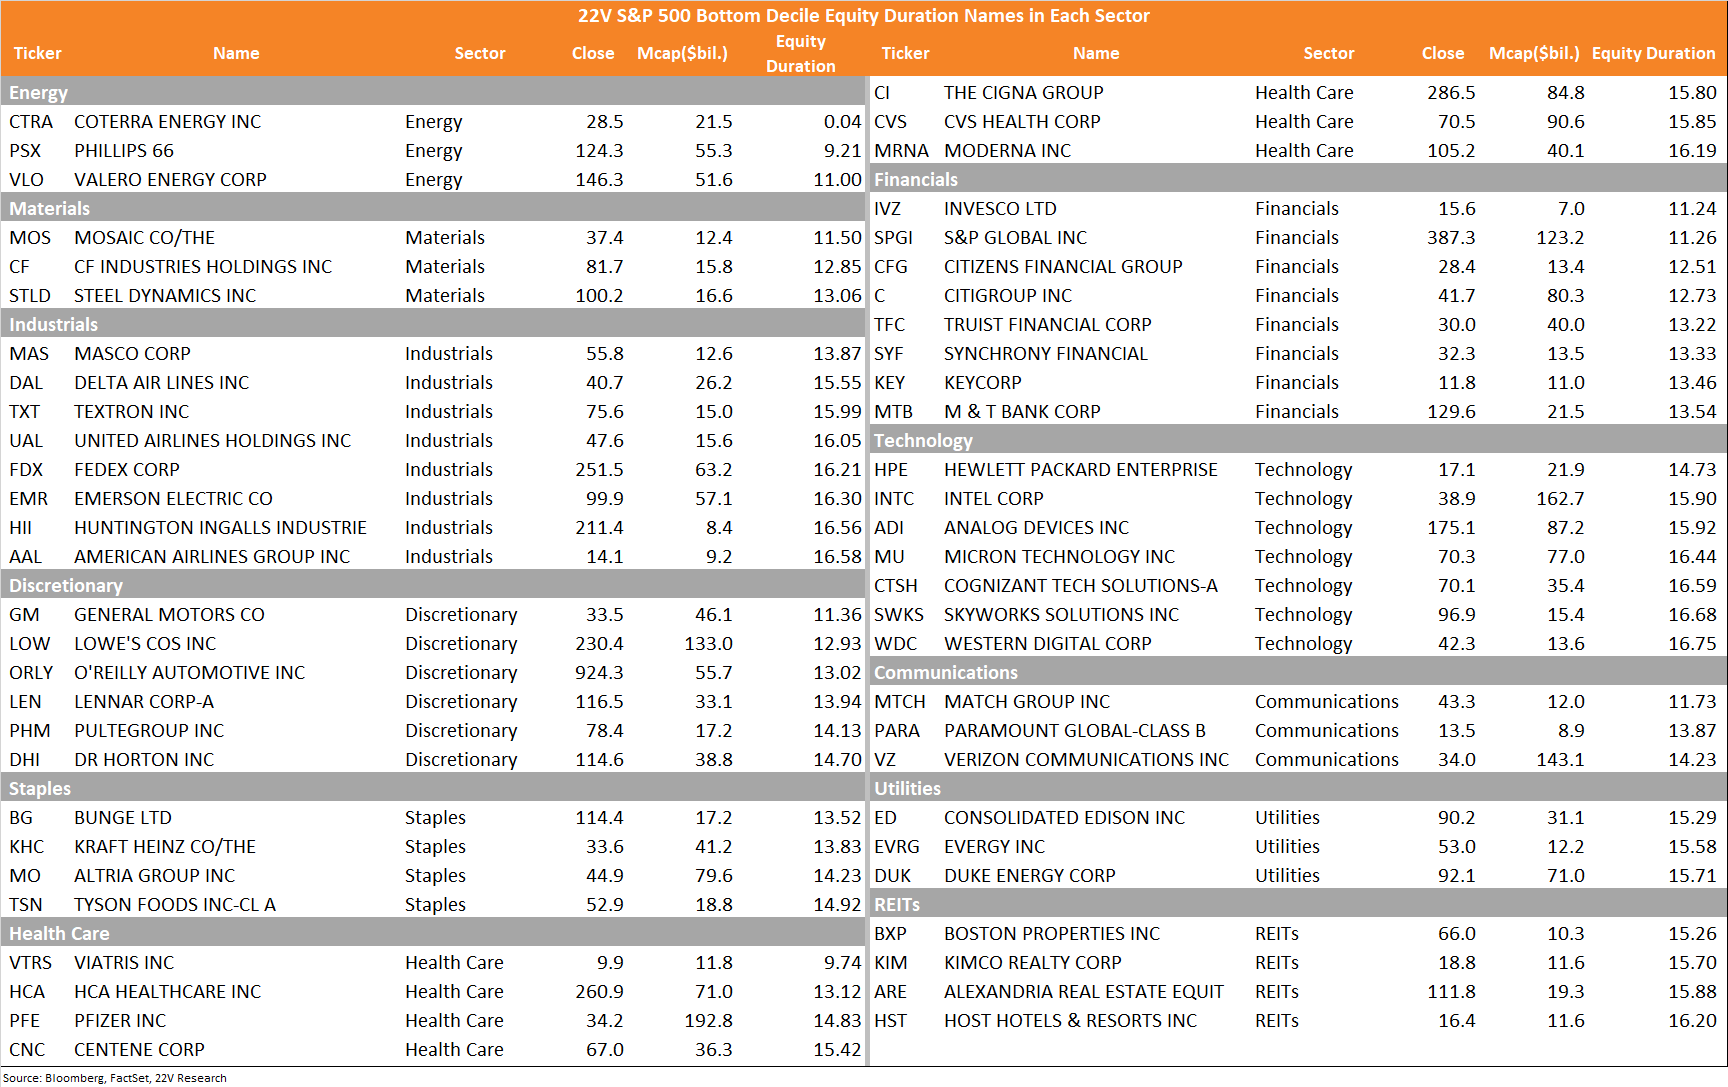
At the end of this report, we list stocks from each S&P sector with the lowest current implied equity duration. These are the names that should be less sensitive to further increases in yields. A complete ranking of S&P stocks is available as well.
Measuring Rate Risk by Implied Equity Duration: Strong economic growth readings have been a major driver of higher US 10yr yield over the past few months, and short rates are at their highest level since the TMT bubble. Concerns that too hot growth will result in more Fed tightening have weighed on stocks in August, driving the short-term correlation between 10yr yields and stocks to an extreme (99th %tile) negative level. Both short-term and long-term equity to Treasury correlations are now negative, the opposite of the generally positive relationship over the past 20 years.
Rising yields exert downward pressure on equities, but sensitivity to yields varies across stocks. Applying the concept of fixed income duration to equities is one way to estimate a stock’s sensitivity to changes in yields. Following the process laid out by Dechow, Sloan, and Soliman (HERE), we constructed an equity duration measure to objectively gauge stock sensitivity to yields. The calculation separates short and long-term cash flows, allowing for a growth period and a terminal perpetual cash flow period that relates the stocks price to its expected future cash flow. This isn’t meant to be a forecast. As the authors noted “Because the terminal cash flow perpetuity is inferred from the observed stock, we refer to the resulting measure of equity duration as implied’ equity duration. In other words, our measure of equity duration is based on investors’ consensus expectations, as reflected in stock prices, rather than on necessarily rational forecasts of future cash flows.” A worked example of AAPL’s Implied Equity Duration is below.
Applying similar calculations across equities and aggregating the fundamentals to the index level shows that S&P implied duration has climbed steadily since 2012 and peaked in mid-2021. Rate hikes combined with the equity market correction in 2022 drove S&P implied duration sharply lower, but it never reached its post-GFC median and has surged higher since late-‘22. The bottom line is that implied duration suggests the S&P is more sensitive to changes in yields than in the past. That is consistent with the extremely negative correlation between yields and stocks today.
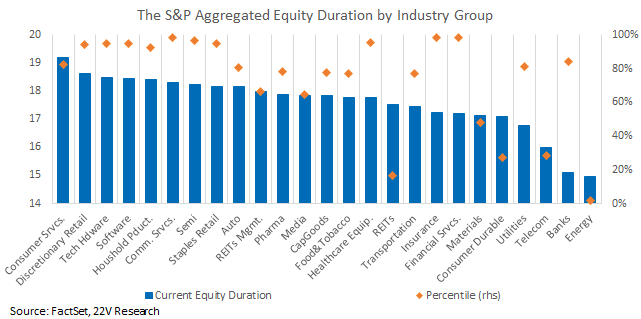
At the industry group level, implied duration is highest among Discretionary industry groups, including Consumer Services and Retail. The implied duration of Energy and Banks is the lowest of the GICS groupings. The absolute level of duration tends to be lower for some groups so looking at duration on a relative basis is important. Energy, REITS, Telecom, and Consumer durables all have implied durations in the bottom half of their normal range (nearly 0th %tile for Energy). Those groups are less sensitive than normal to high yields today. That is an important point. It is not that those groups are not necessarily sensitive to yields, just that they are priced such that they are less sensitive today.
Helpful for the current backdrop, Implied Equity duration is uncorrelated with other risk exposures. High vs. low implied duration names have roughly equal exposure to risk-on/off factors. Duration is similar to the style trade in construction and behavior, so high implied duration tends to be Growth, and low implied duration tends to be Value. This also helps explain why Growth has struggled as yields have surged higher while Value has fared better.
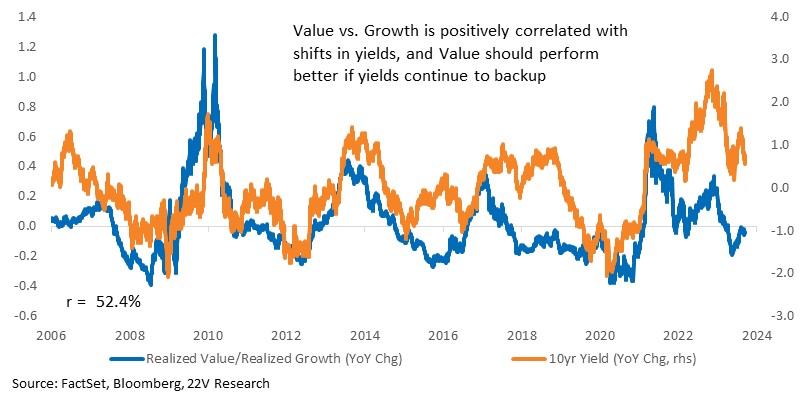
That confirms teh broad style factor performance relationship with 10yr yield changes. Realized Value outperformed Realized Growth during rising yield periods as the names are less sensitive to higher yields. A reversal of yields would be a support for Growth. Yields continuing to climb would support Value on a relative basis.
Below we list stocks from each S&P sector with the lowest current implied equity duration. These are the names that should be less sensitive to further increases in yields.