
Our entire repository of COVID charts is HERE.
Supply chain sentiment dropped last week and freight rates increased a little. Mobility in important supply chain countries has fallen a touch while median case growth in the area has increased. However, mobility is still near a cycle high and, importantly, vaccination rates across the region are significantly better than during the summer wave. Vaccines decouple cases from severity, which allows the economy to continue to function despite case growth.

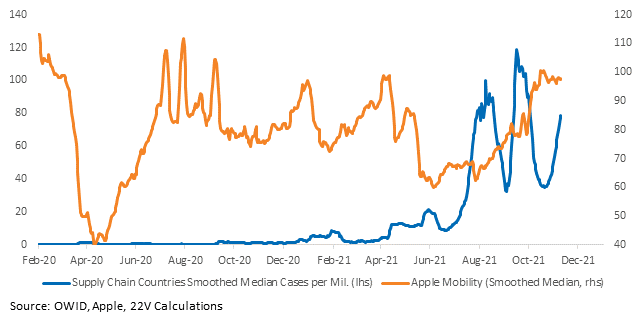
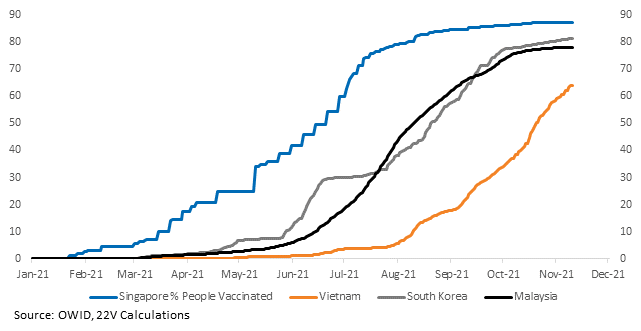
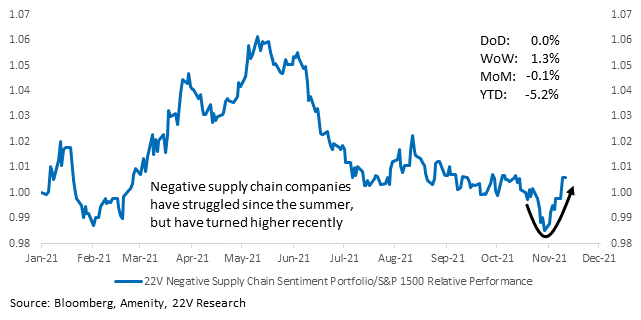
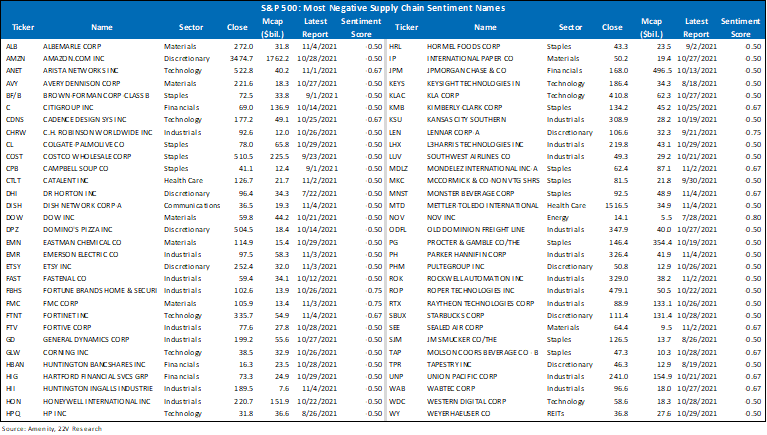
Anecdotal data about supply chains are abundant, but there is a lack of comprehensive data that tells a coherent story. Shutdowns of a particular factory or region, slow unloading at a specific port, or a chassis shortage in a region can significantly impact distribution while similar events in other areas are quickly absorbed. To track changes in supply chain issues, we constructed a portfolio of the large-cap stocks with the most negative supply chain sentiment readings. If bottlenecks ease, these are the companies we would expect to signal the most improvement, translating into improving stock prices. Performance has indeed picked up.
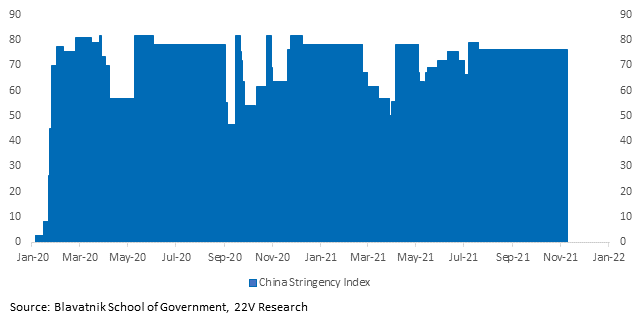
China’s stringency index has remained stable despite headlines about case growth. China’s zero-covid policy has added to concern about supply chains. Since China’s COVID data is opaque and mobility data is nonexistent, we will continue to rely on Oxford’s stringency indices to gauge the severity of China’s lockdowns instead.
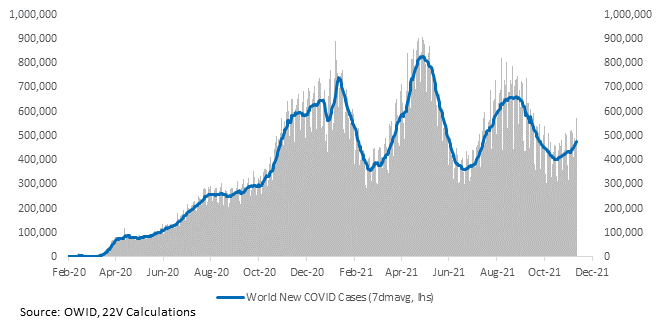
Global case growth is still increasing and concentrated in Europe and parts of Asia.
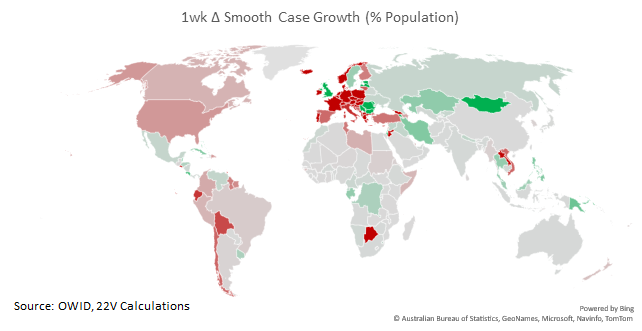
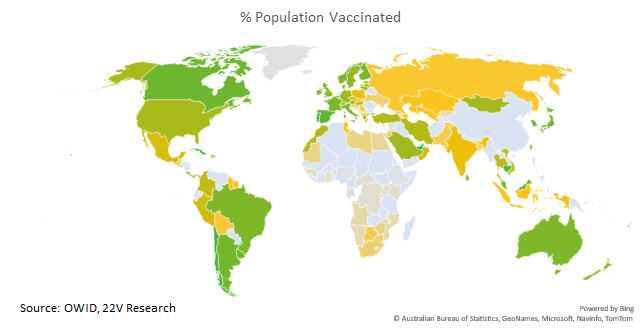
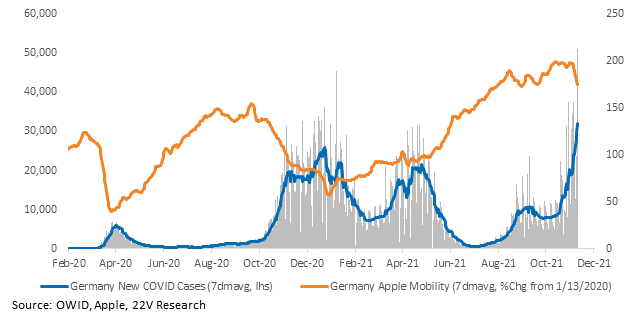
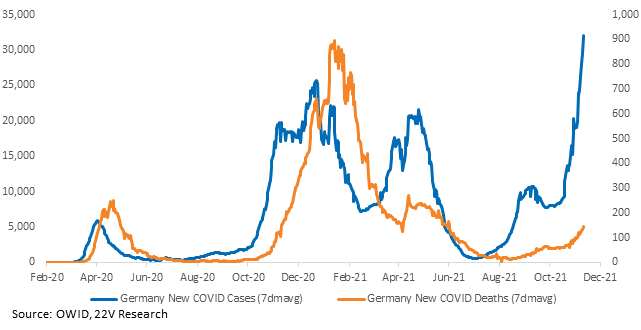
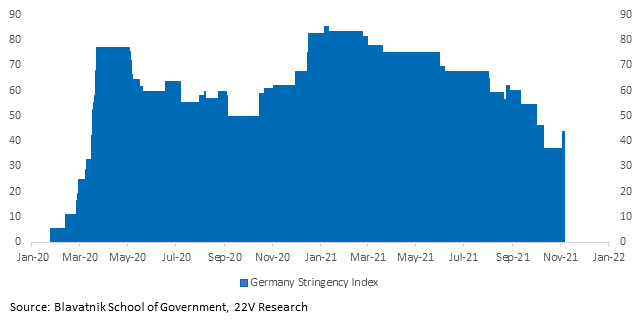
Case growth in Germany hit a new record high. But the economic effect is unlikely to be severe. Mobility is falling but still high. Importantly, deaths are low and the number of patients in intensive-case beds is now less than half of what it was during the peak in January. Germany’s health minister reported that the new wave is “mainly among the unvaccinated.” The government is prepping new rules to handle the outbreak, but the rules are about testing and vaccinations, not lockdowns. Rules can be about vaccinations rather than lockdowns since vaccines are working (the outbreak is not in the vaccinated).
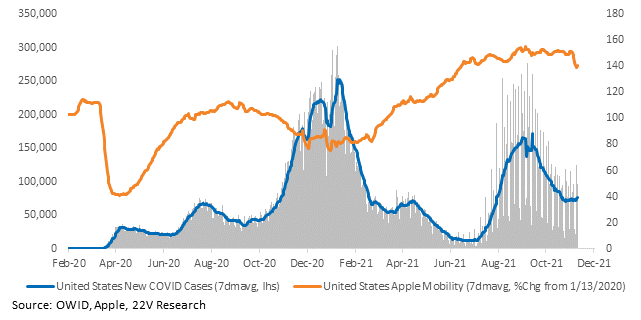
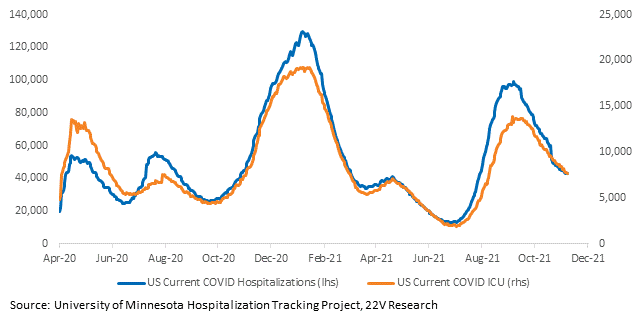
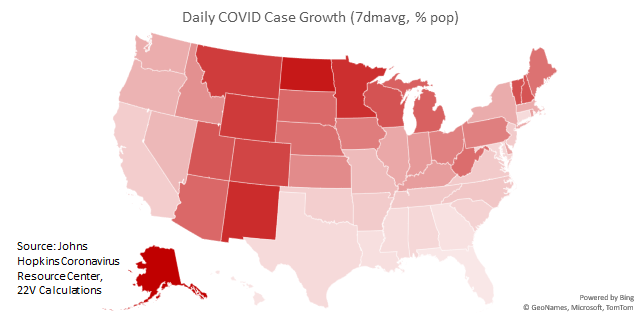
Case growth in the United States is stagnant. Cases are worst in the Mountain West, which does not have a large portion of the American population. At the national level, mobility is still high and net hospitalizations and ICU admissions are still falling.
Charts for every state and country we have data for are HERE.

