
Our entire repository of COVID charts is HERE.
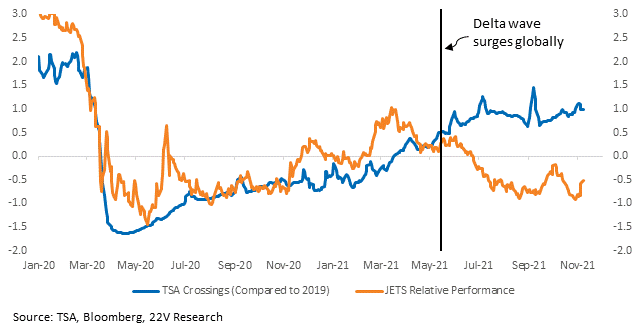
Most mobility metrics remained strong as the delta wave spread across the globe, spurring another round of limited economic lockdowns. Air travel, measured using TSA crossing data, was hit particularly hard. Overall, TSA crossing are still down -20% relative to 2019 levels. With the U.S. officially reopened to international travel with reports of surging demand, some of the gap should close.

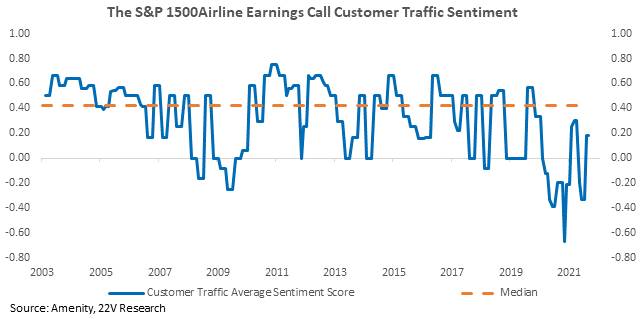
Coming out of 3Q reporting season, customer traffic sentiment for Airlines (S&P 1500) moved higher but was still below its median level. Overall, the Transportation industry is expected to see a +140% increase in earnings in 2022 with Airlines expected to move from full year losses back into positive earnings.
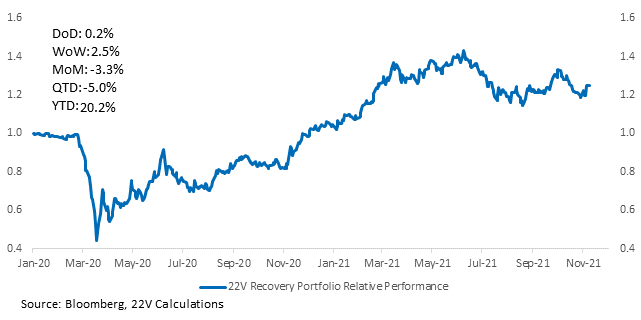
Recovery stocks, which have struggled over the past quarter from a combination of COVID, supply constraints, surging oil prices, and global growth slowdown fears, are continuing to move lower today as Discretionary names come under pressure.
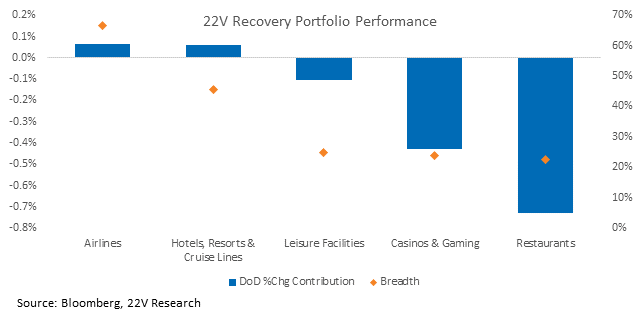
Within the Recovery basket though, Airlines are surging. As supply constraints and COVID headwinds fade, a rebound in Recovery names overall should be expected, but headwinds remain for the broad group.
Since the delta wave of COVID spread across the globe, the performance of Airlines has diverged from the firming of travel demand (measured below using U.S. TSA crossings). Near term, Airlines enjoy catalysts from U.S. reopening and surging consumer demand during the holiday season. Any downward pressure on oil prices would help the group as well.
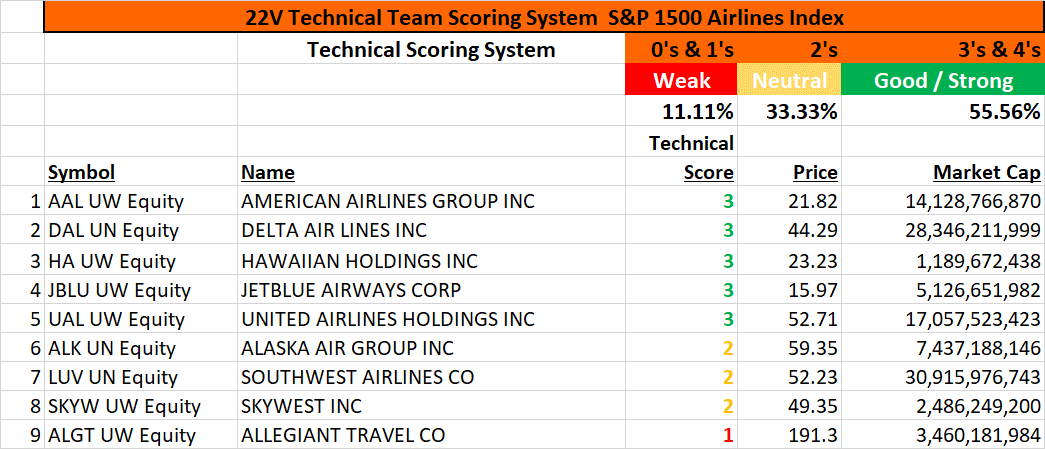
John Roque, 22V’s Technical Analyst, put together technical scores for the S&P 1500 Airlines group.
The “system” uses a scoring range of 0 – 4:
0’s & 1’s = poor, weak, bearish
2’s = neutral
3’s & 4’s = good, strong, bullish
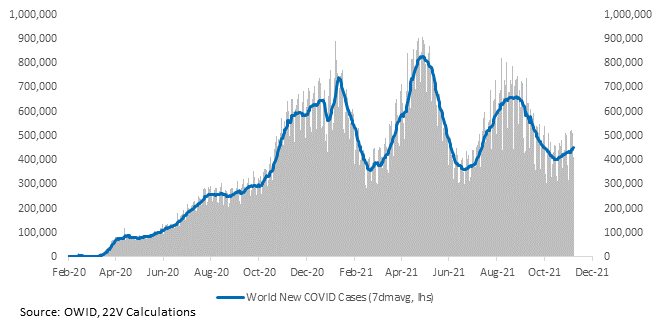
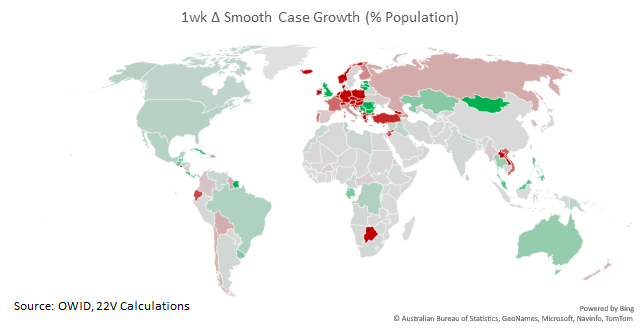
Global case growth still presents a risk to the group, though the progression of reopenings is currently prevailing. Part of the reason for that is that case growth is concentrated in Eastern Europe and Russia, which account for 4% of air travel (according to 2019 data from the World Bank). Meanwhile, the $1 billion connection from NY to London is back online.
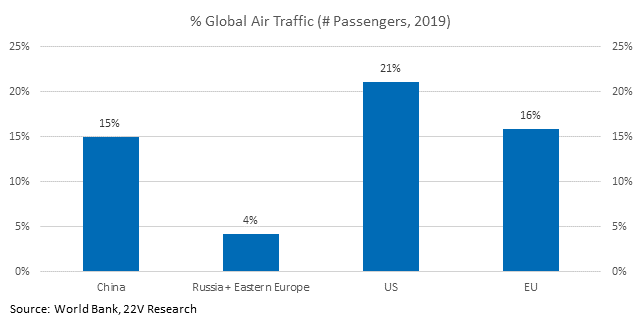
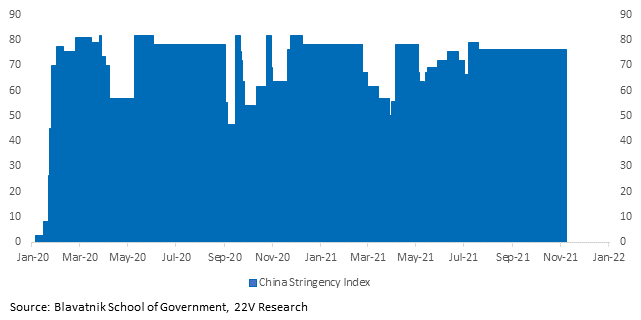
China’s case growth is still generating headlines. China accounted for 14% of air travel in 2019 and creates more concern about supply chains. We are following Oxford’s stringency indices to gauge how severe China’s restrictions are. So far, restrictions are constant and at a high level. Vaccines should help.
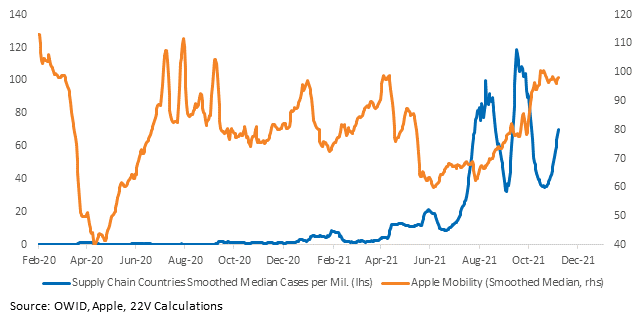
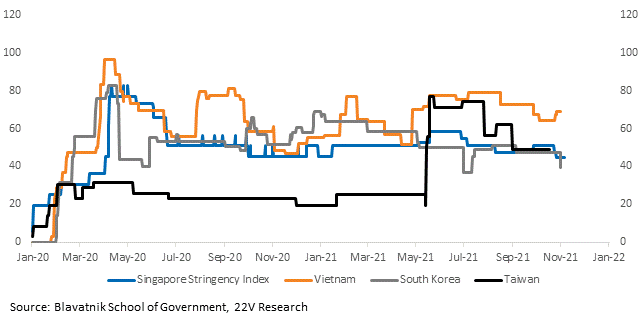
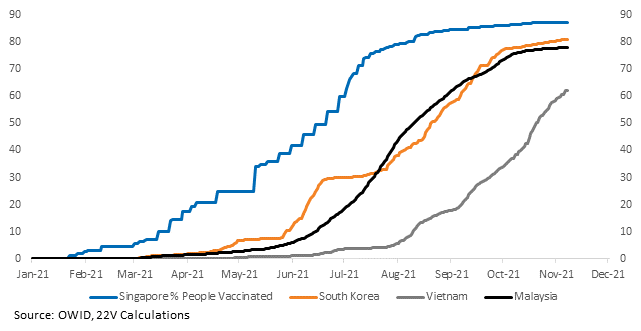
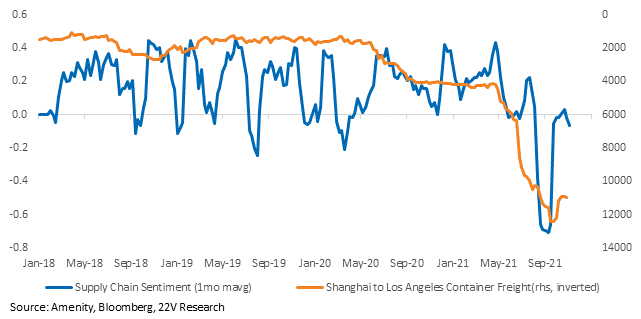
Case growth is higher in other important supply chain countries as well, but mobility continues to recover. Vaccination across the region are high, which certainly contributes to better mobility as cases are decoupled from hospitalizations and deaths. Supply chain sentiment is dramatically less negative than it was. Continued improvement in freight rates will help ease supply constraint narratives.
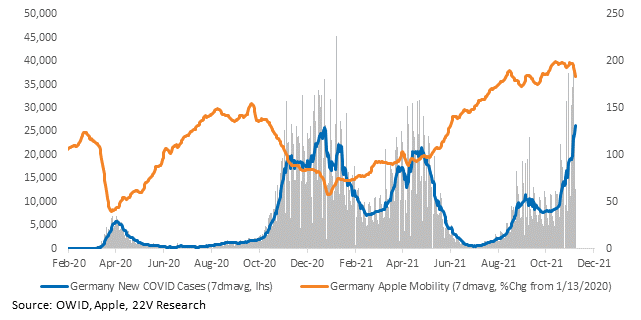
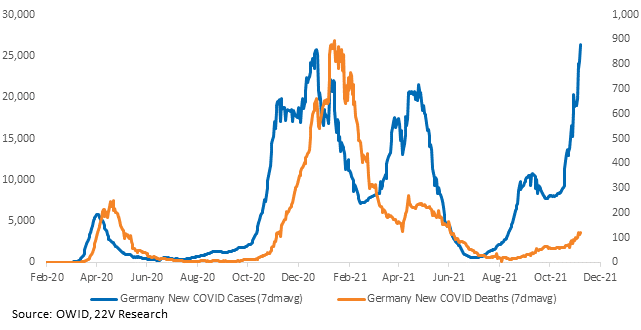
Case growth in Germany is increasing. But, again, vaccinations enable the continuation of activity by decoupling case growth from hospitalizations and deaths.
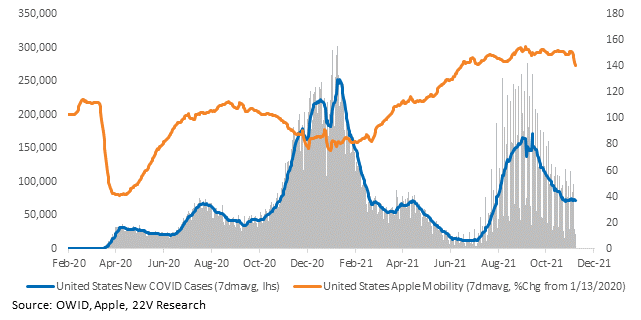
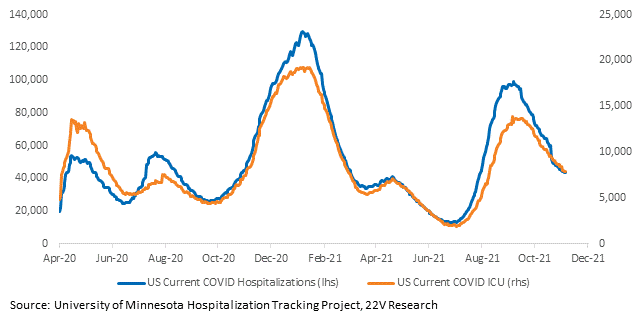
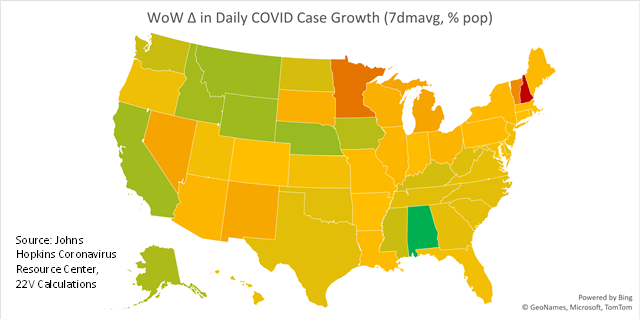
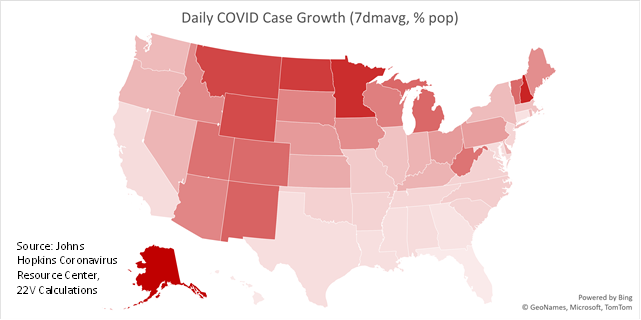
Case growth is stagnant in the U.S. Hospitalizations and ICU utilization continues to decline. No major developments to report.
Charts for every state and country we have data for are HERE.

