
Our entire repository of COVID charts is HERE.
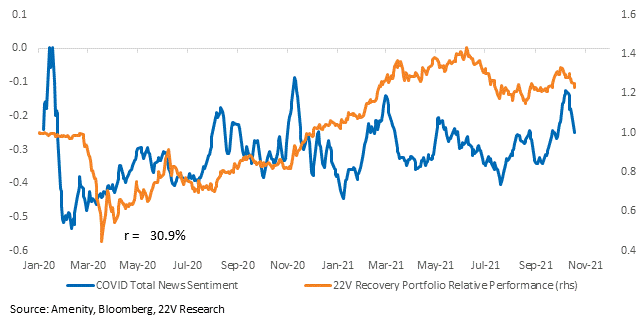
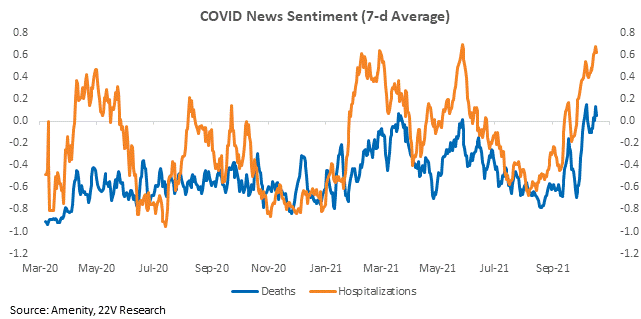
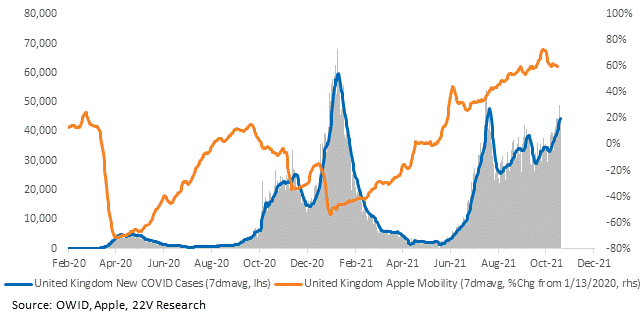
COVID sentiment dropped last week as more headlines about delta plus surfaced. Delta plus has caused increased case growth in the U.K., stoking some concern that another wave of case growth will pressure the global economy. Worse sentiment is a headwind to the performance of our Recovery Portfolio. However, news sentiment about deaths and hospitalizations are near their highs.
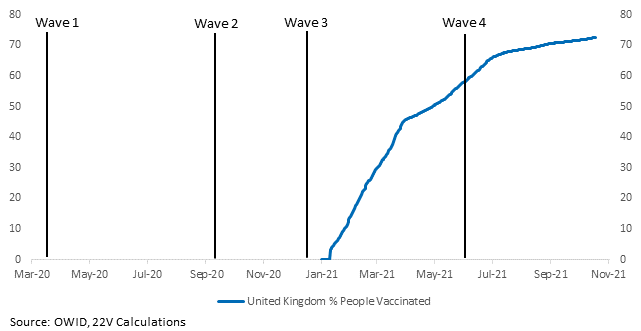
Case growth in the U.K. is misleading. Young people are unvaccinated and attending schools without mask mandates. So, the current wave of case growth hasn’t overwhelmed vaccines and masks. Also, COVID is much less dangerous for younger cohorts. And, as we mentioned yesterday, German researchers found delta plus doesn’t appear to be deadlier than delta. So, there’s unlikely to be significant changes in behavior.
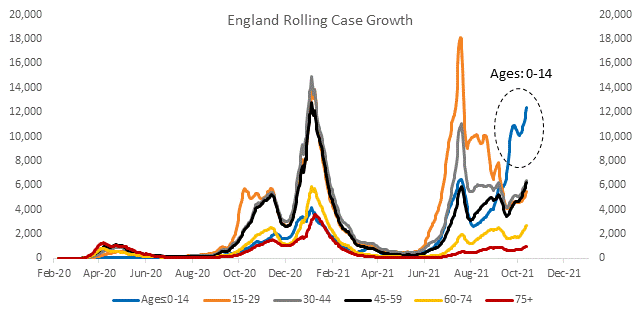
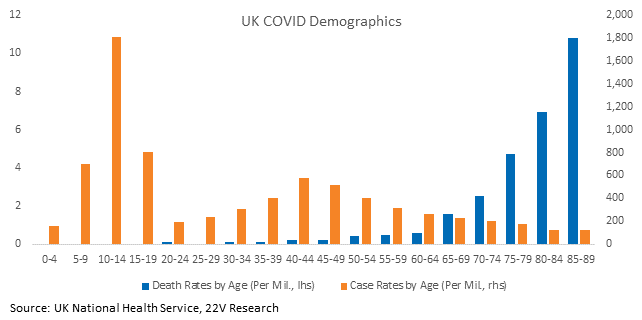
One of the risks is spreading the sub-variant to other, more at-risk cohorts. But those groups are vaccinated this time around. The other risk is around new restrictions from governments, which some groups in the UK are calling for now. It seems unlikely that broad restrictions are coming since the severity is so low, but investors are waiting to see if living with COVID policies will remain in place. Until that becomes clear, reopening shares will likely consolidate.
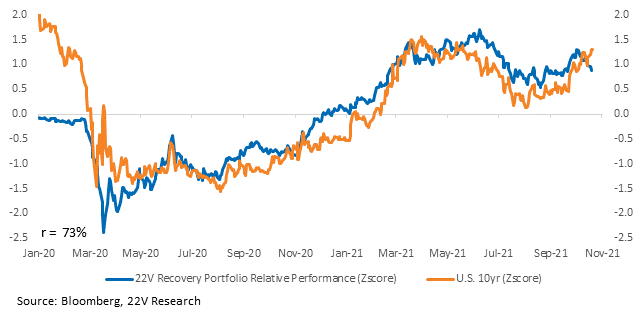
The 10yr UST yield has consolidated along with reopening stocks. The new Delta sub-variant doesn’t have to be a problem and demand doesn’t have to fall off to impact 10yr yields. Recall, 10yr yield are used as a hedge against bad outcomes.
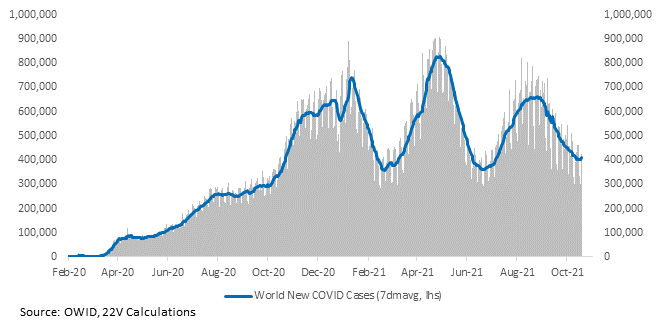
Average global case growth has increased a little, driven by hot spots in Europe and Asia.
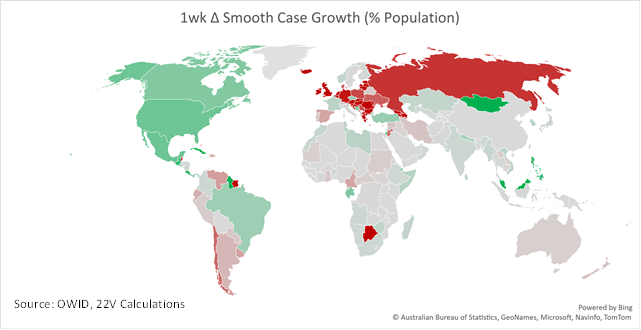
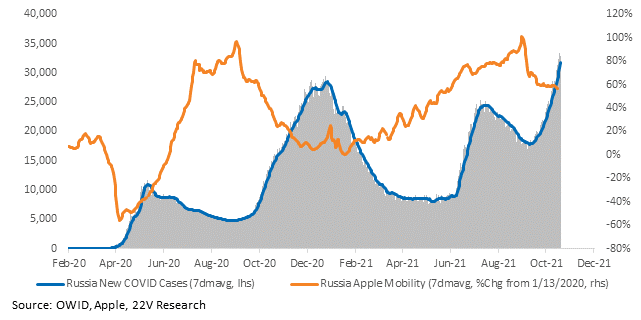
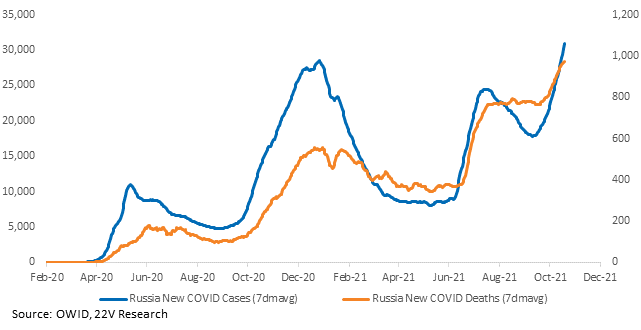
Russia is instituting new lockdowns to combat its current wave, which is now the worst it has had to date. Only 35% of the population is vaccinated.
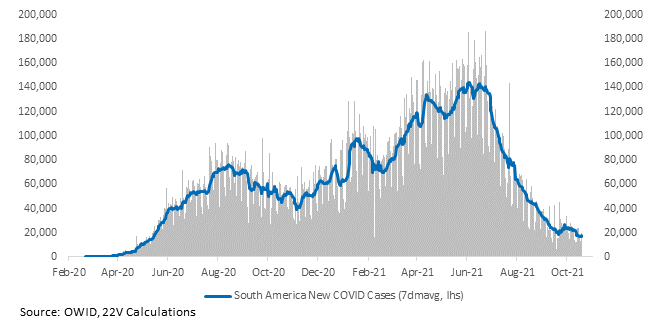
There is red on the map in South America, but that’s because case growth doesn’t have much room to fall.
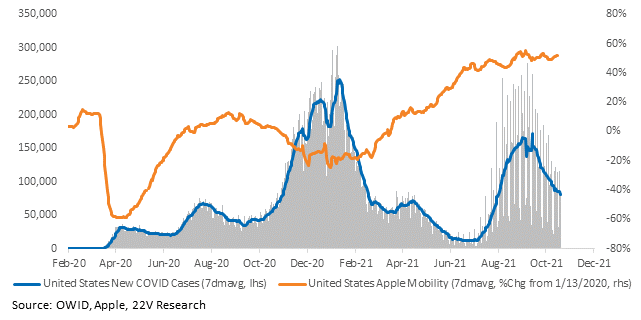
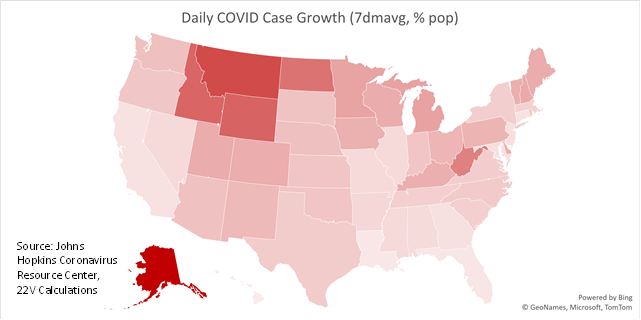
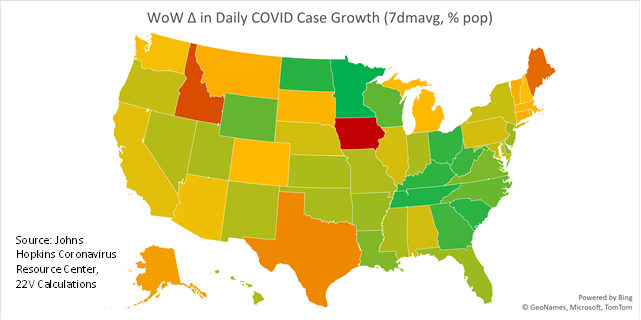
The trends in the United States are good. No update here.
Charts for every state and country we have data for are HERE.

